

Open the breakdown
-
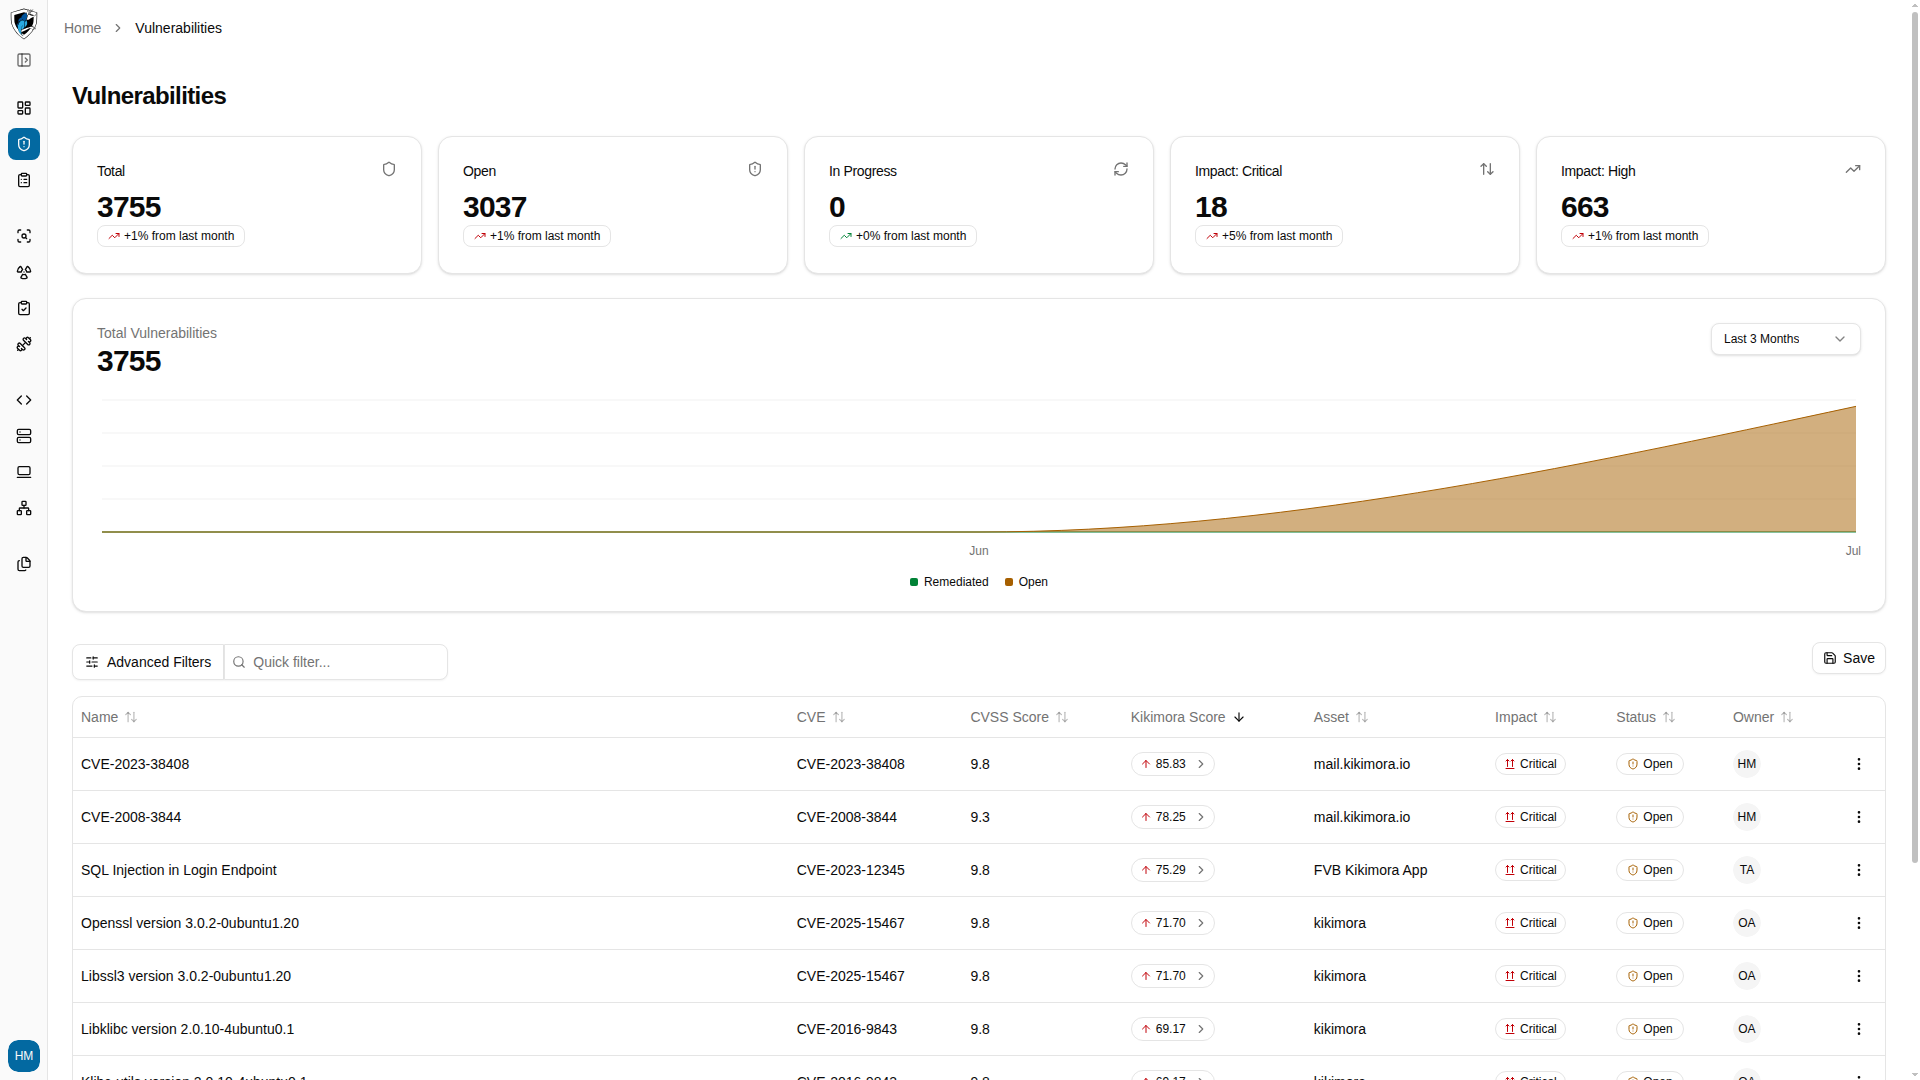
On the Vulnerabilities page, find the Kikimora Score column. Each pill has an arrow button on its right, labelled View score breakdown.
-
Click the arrow to open the breakdown panel for that finding.
What the panel shows
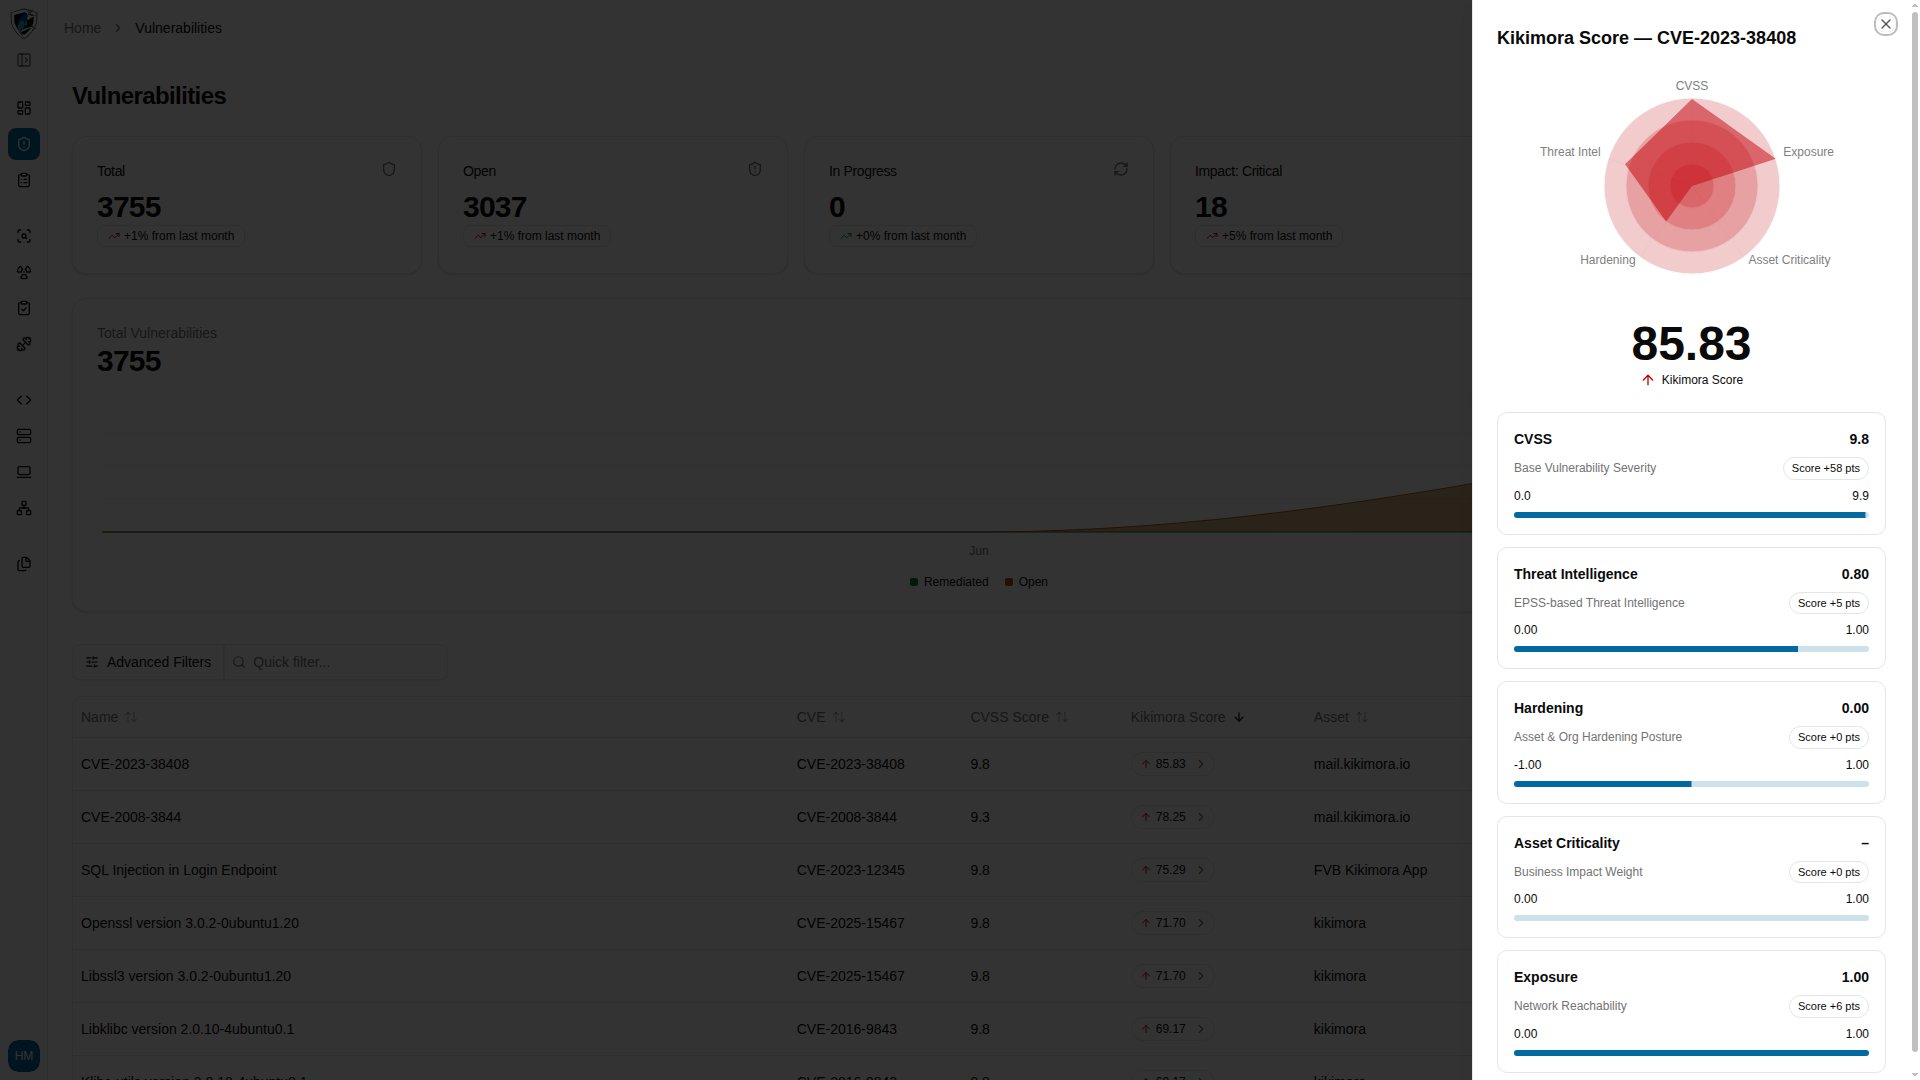
The panel is titled with the CVE it describes — for example Kikimora Score — CVE-2023-38408. At the top, a radar chart plots the finding across all five factors at once, so a glance tells you which dimensions are driving the score. Below it sits the total Kikimora Score, and under that, one card per factor.The five factors
Each card shows the factor’s measured value, the range it is measured on, and the points it contributed to the total.
Hardening is the only factor that can subtract. Its range starts at
-1.00, so a well-hardened asset pulls a finding’s score down, while a poorly hardened one pushes it up. The other four only ever add.
Asset Criticality shows a dash when unset. If nobody has assigned a business impact weight to the asset, the card reads – and contributes Score +0 pts. Setting criticality on your important assets is what makes this factor do useful work.
Reading a worked example
ForCVE-2023-38408 scoring 85.83:
- CVSS
9.8— Score+58 pts. A critical base severity does most of the lifting. - Threat Intelligence
0.80— Score+5 pts. A high EPSS probability that this gets exploited in the wild. - Hardening
0.00— Score+0 pts. Neutral posture, so no adjustment either way. - Asset Criticality
–— Score+0 pts. No business impact weight assigned. - Exposure
1.00— Score+6 pts. The asset is fully network reachable.
Related
- Browsing and filtering — sort the table by Kikimora Score to triage by contextual risk.
- Risk management — how these scores aggregate into portfolio impact.