
...) on the Endpoints table.
A tab bar at the top right switches between five views, each on its own URL.
Tabs
Networks
/endpoints/<endpoint-id> or /endpoints/<endpoint-id>/networks
Network interfaces configured on the host, physical and virtual. Columns: Interface Name, MAC Address, IP Address, Netmask, Type, State.
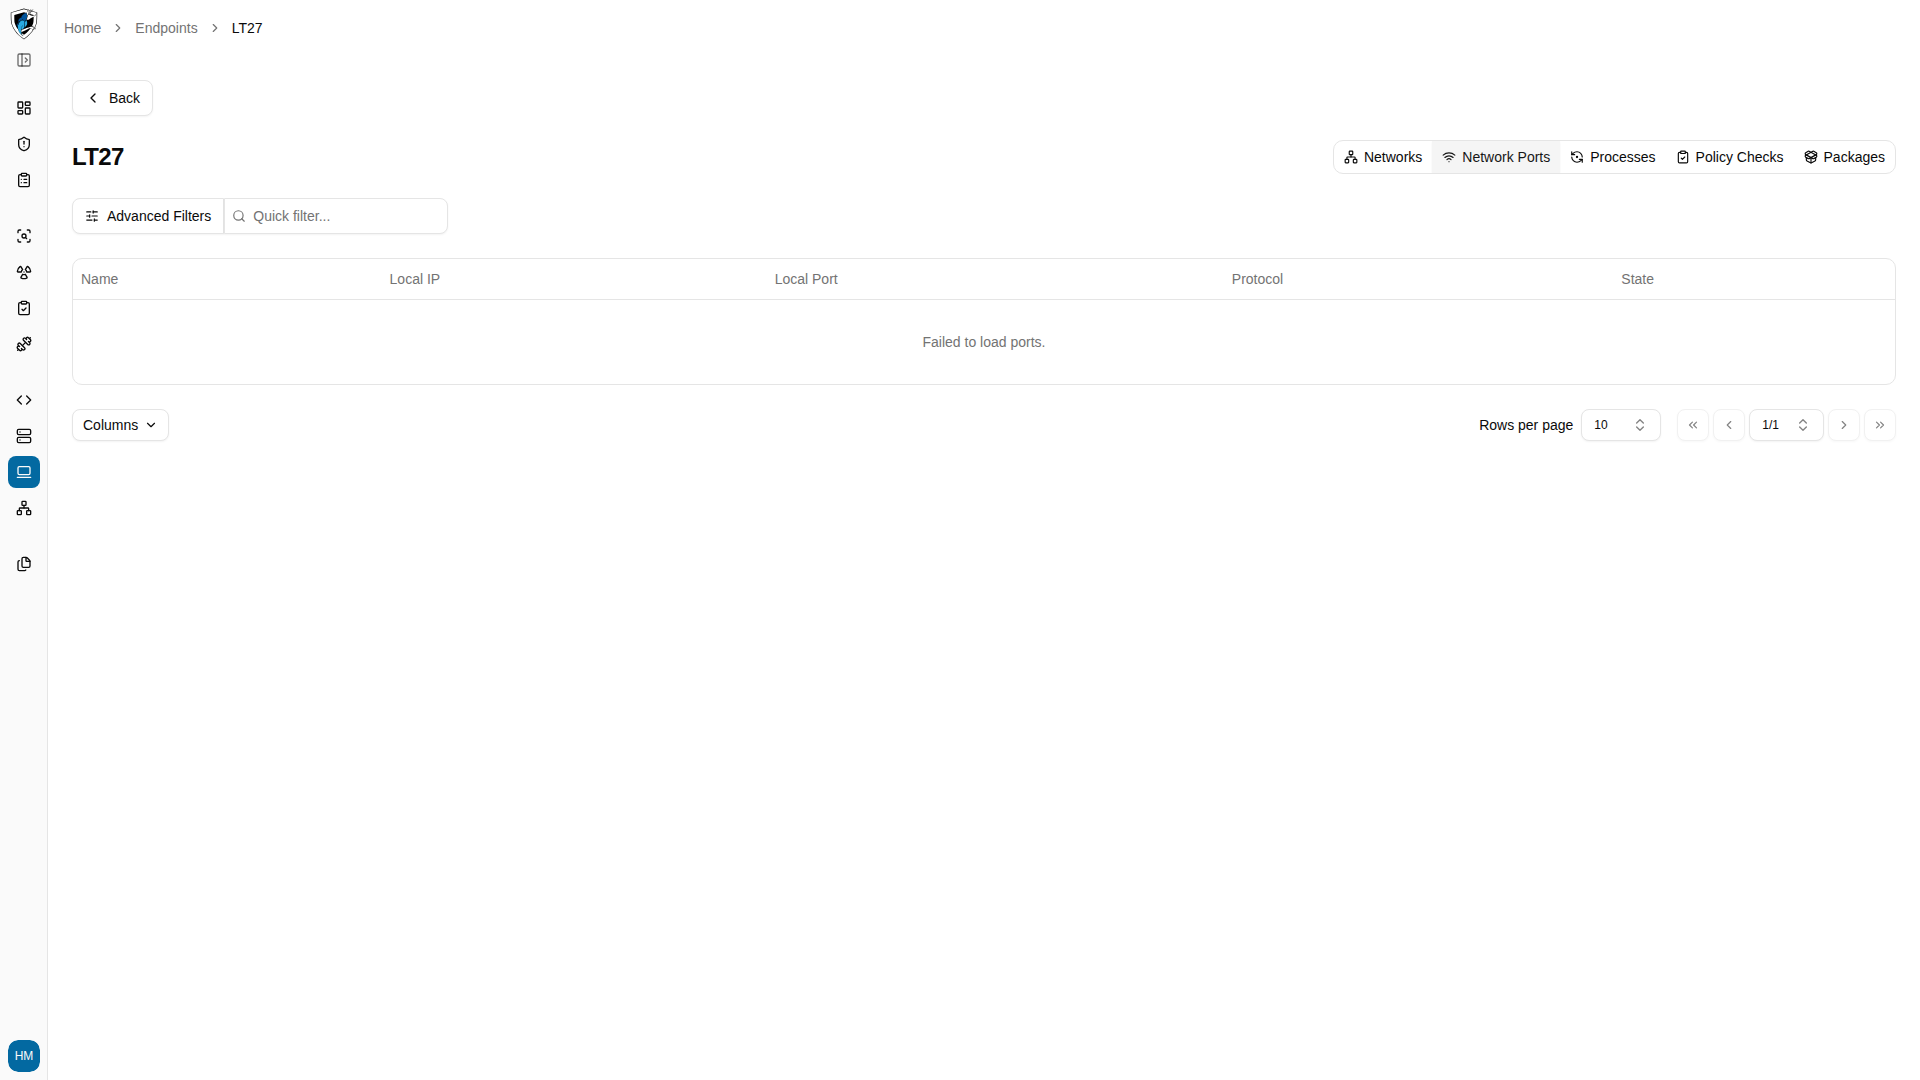
Network Ports
/endpoints/<endpoint-id>/ports
Listening and active ports the agent observes. Columns: Protocol (TCP/UDP), Local Address, Local Port, Remote Address, Remote Port, State, Process ID / Name.
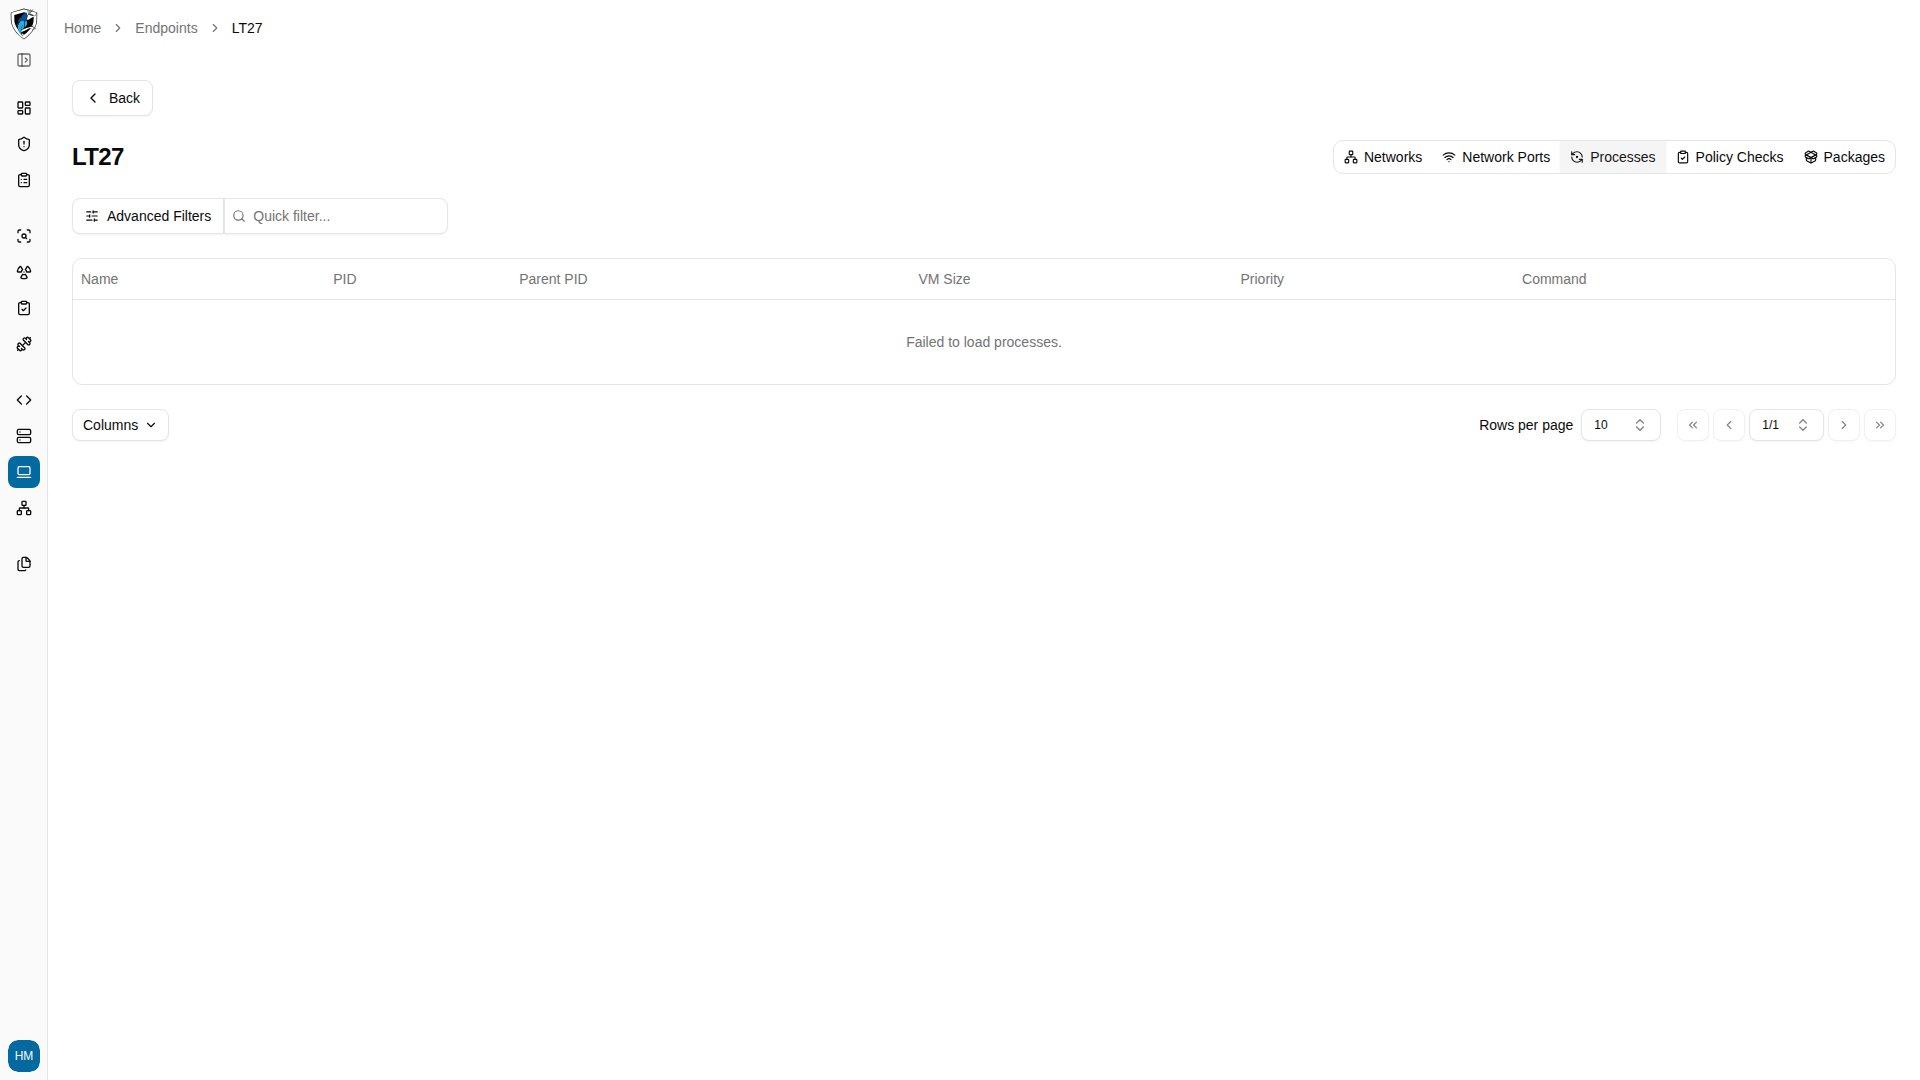
Processes
/endpoints/<endpoint-id>/processes
Running processes captured during the agent’s inventory sync. Columns: Process ID, Name, Path, User / Owner, CPU Usage, Memory Usage.
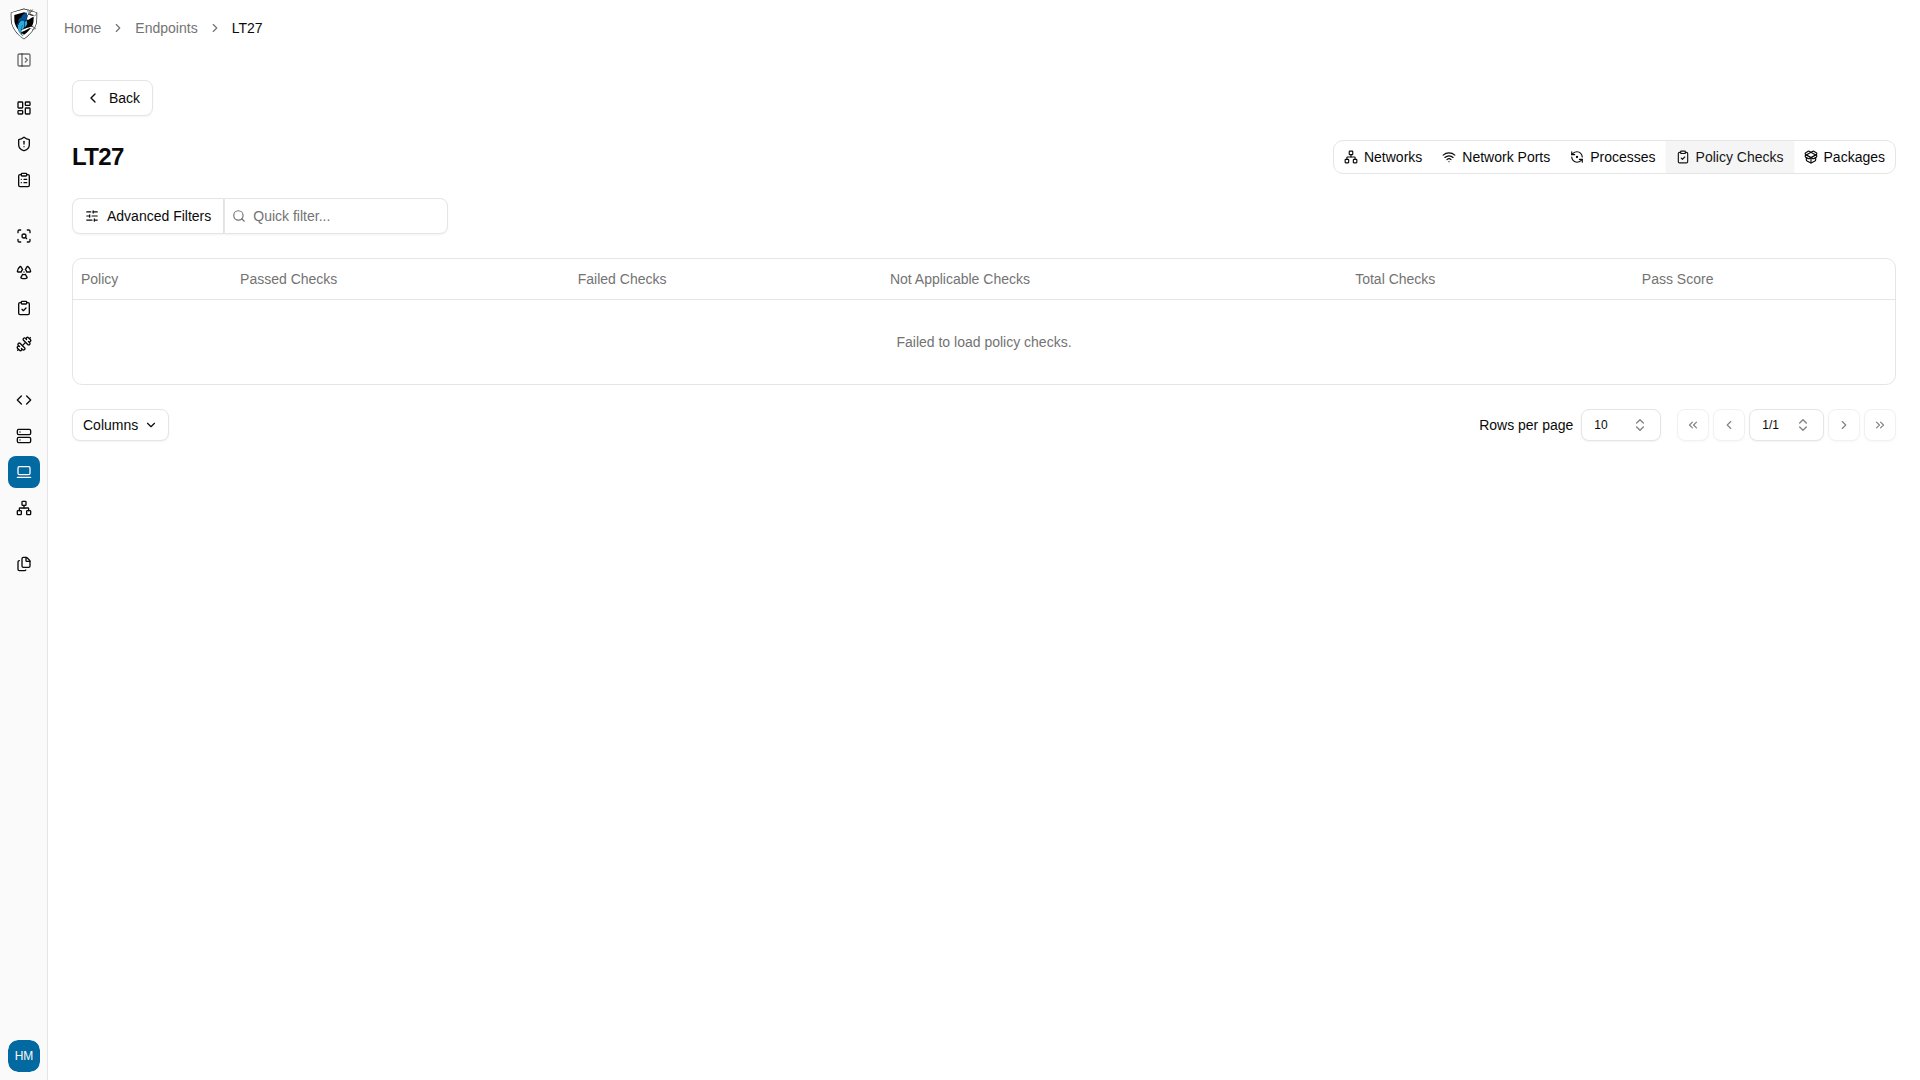
Policy Checks
/endpoints/<endpoint-id>/policy-checks
Security compliance benchmarks applied to the endpoint, such as CIS benchmarks and SCA checks. Columns: Policy Name, Status (Passed / Failed), Total Checks, Passed Checks, Failed Checks, Compliance Score.
Clicking a policy row opens the detailed results, listing each rule evaluation with its remediation instructions and rationale.
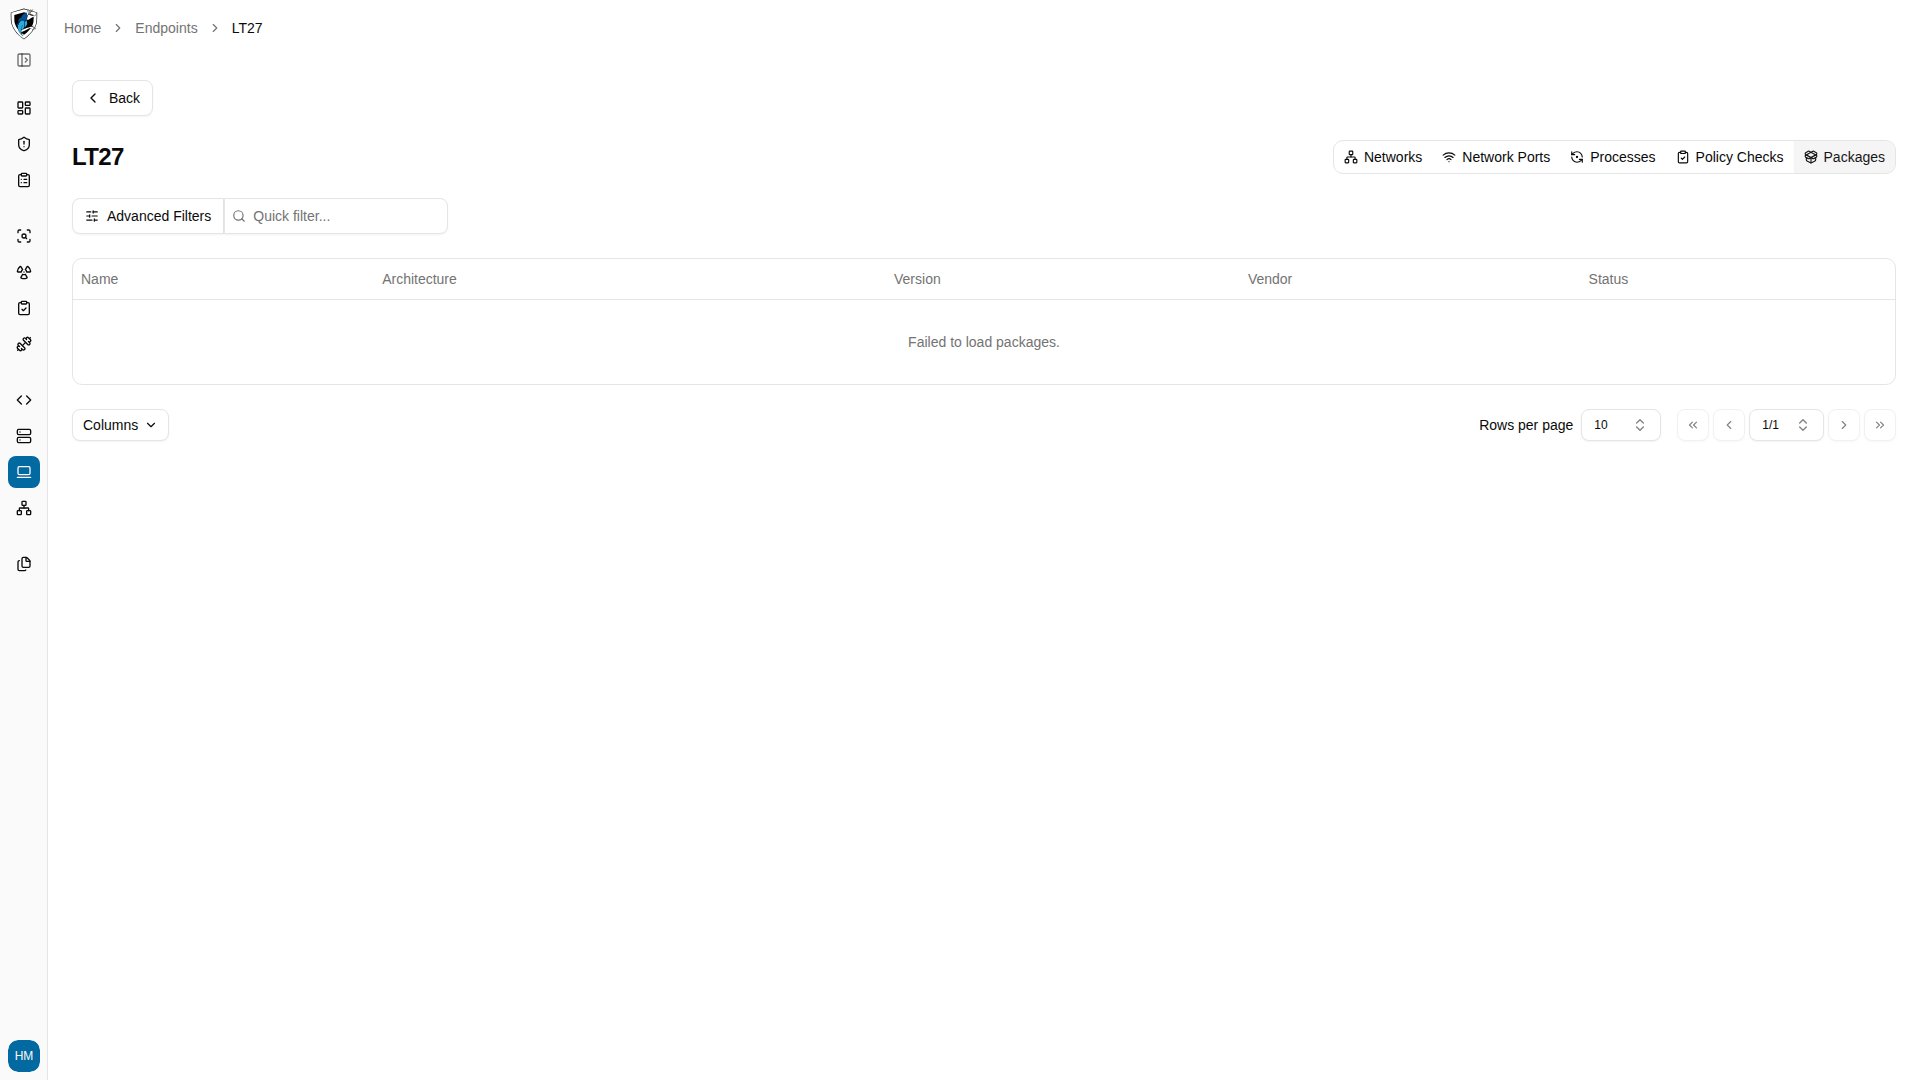
Packages
/endpoints/<endpoint-id>/packages
Installed software, applications, and patches reported by the agent. Columns: Package Name, Version, Architecture, Vendor, Install Time, Description.
Move through the tabs
-
Open the row action menu (
...) for a host and click View Details. You land on Networks.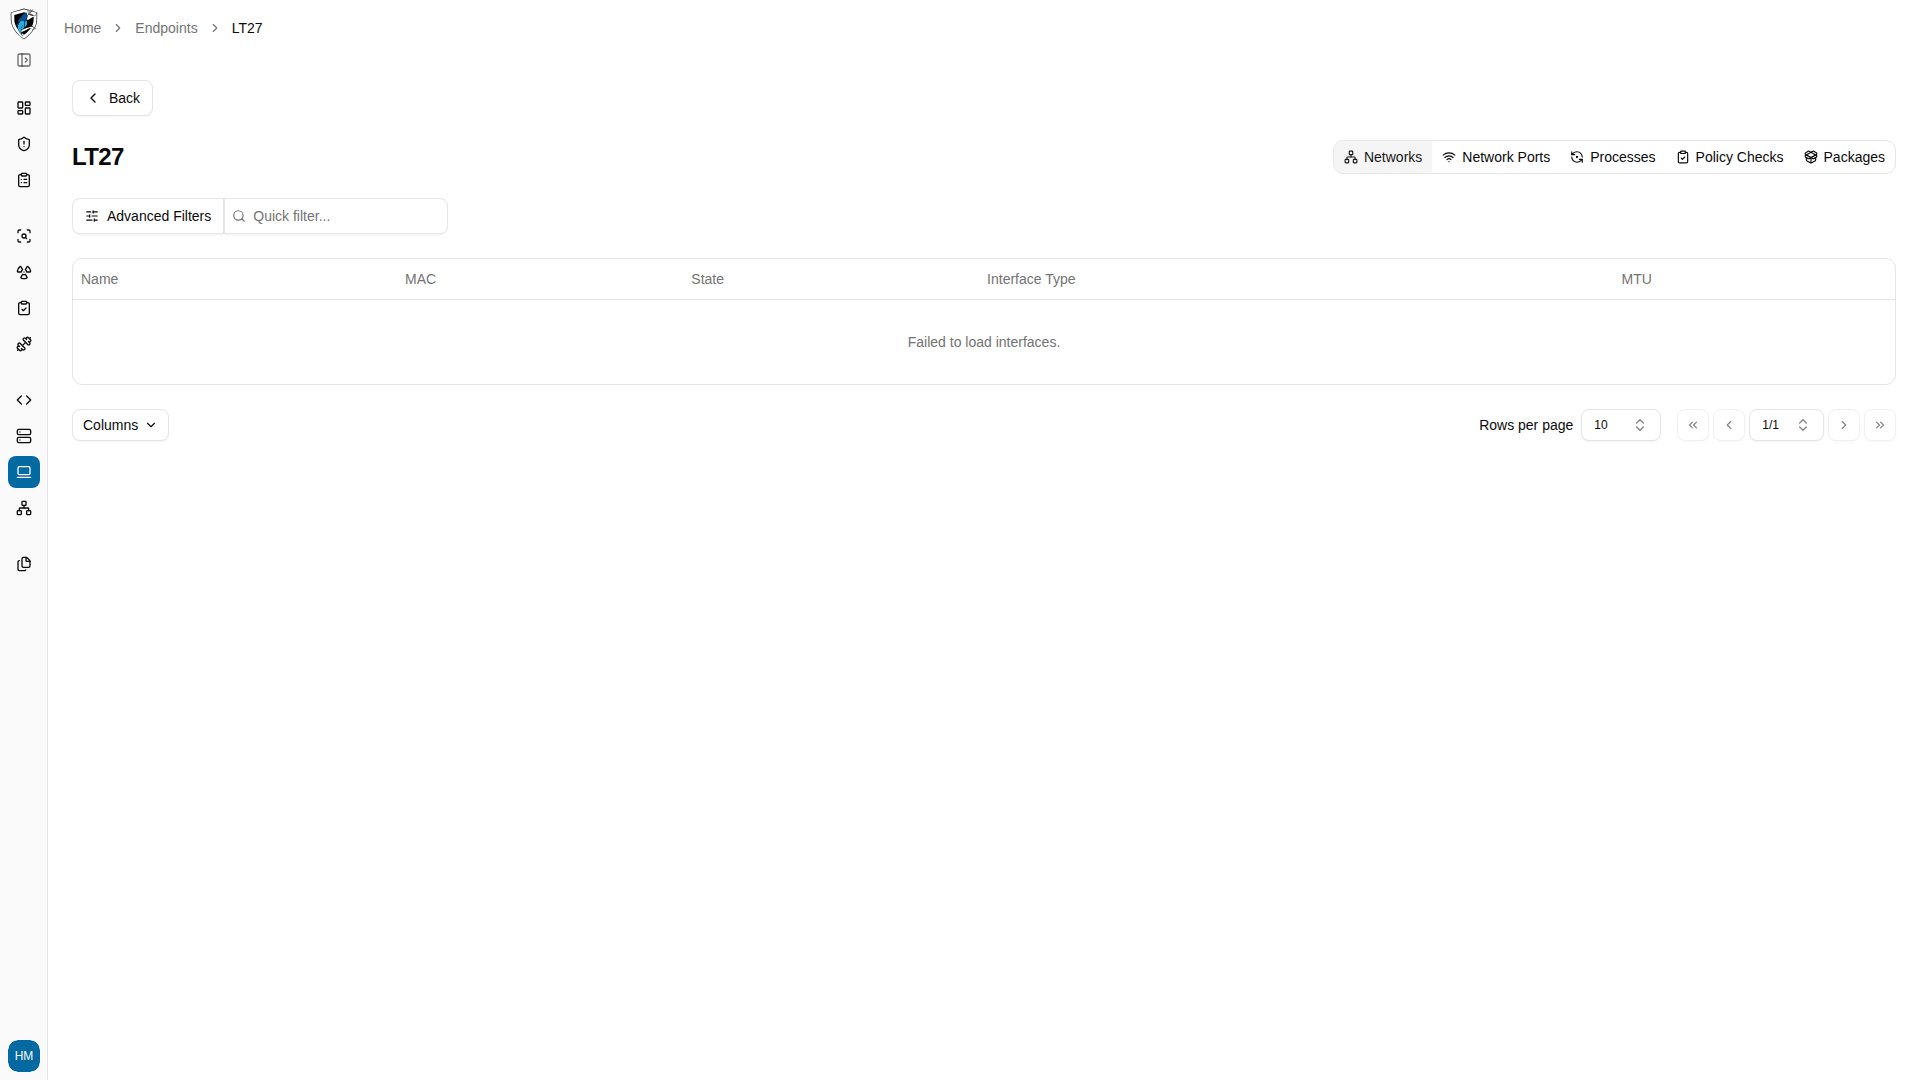
-
Click Network Ports to see active listening ports and connections.
-
Click Processes for running processes and their resource use.
-
Click Policy Checks for compliance benchmark results.
-
Click Packages for the installed software inventory.