

What the detail view shows
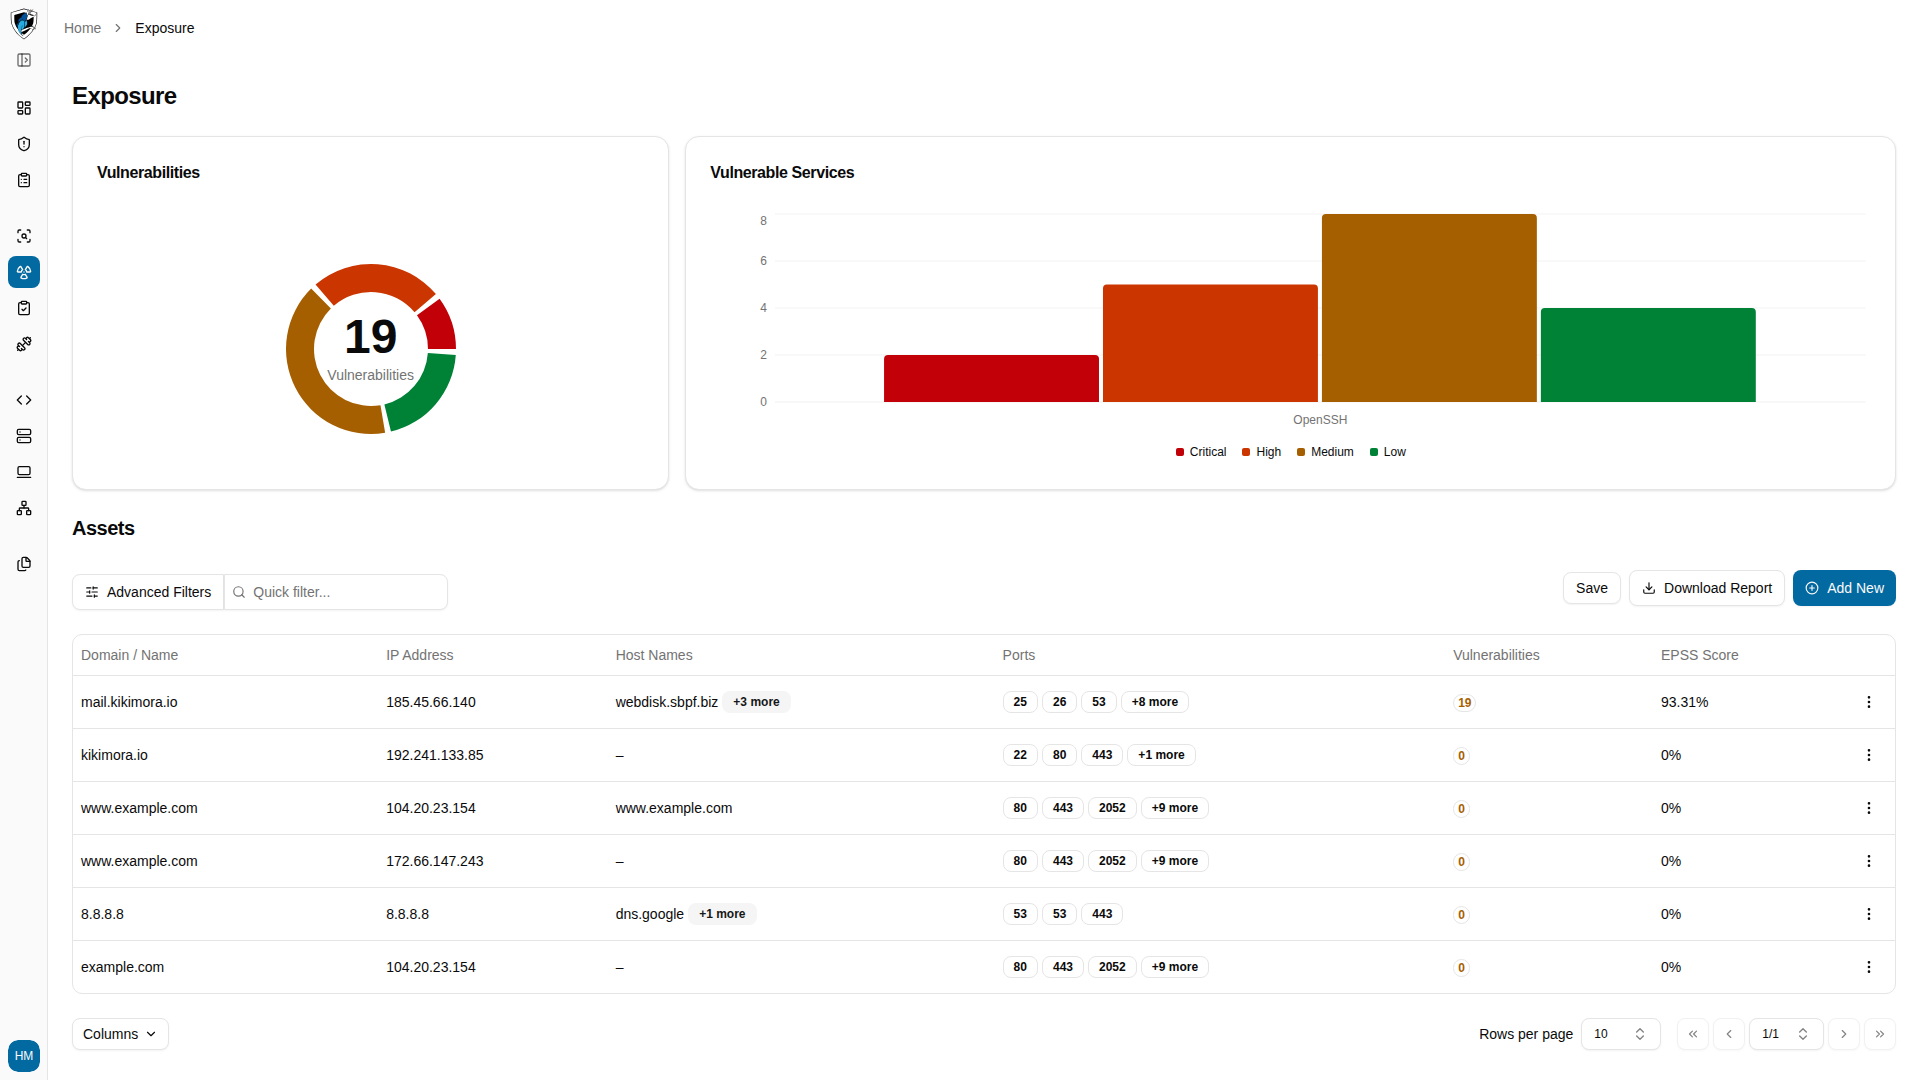
- Clickable cells — both the Domain / Name and IP Address cells in the Exposure table are links that open the asset’s detail view.
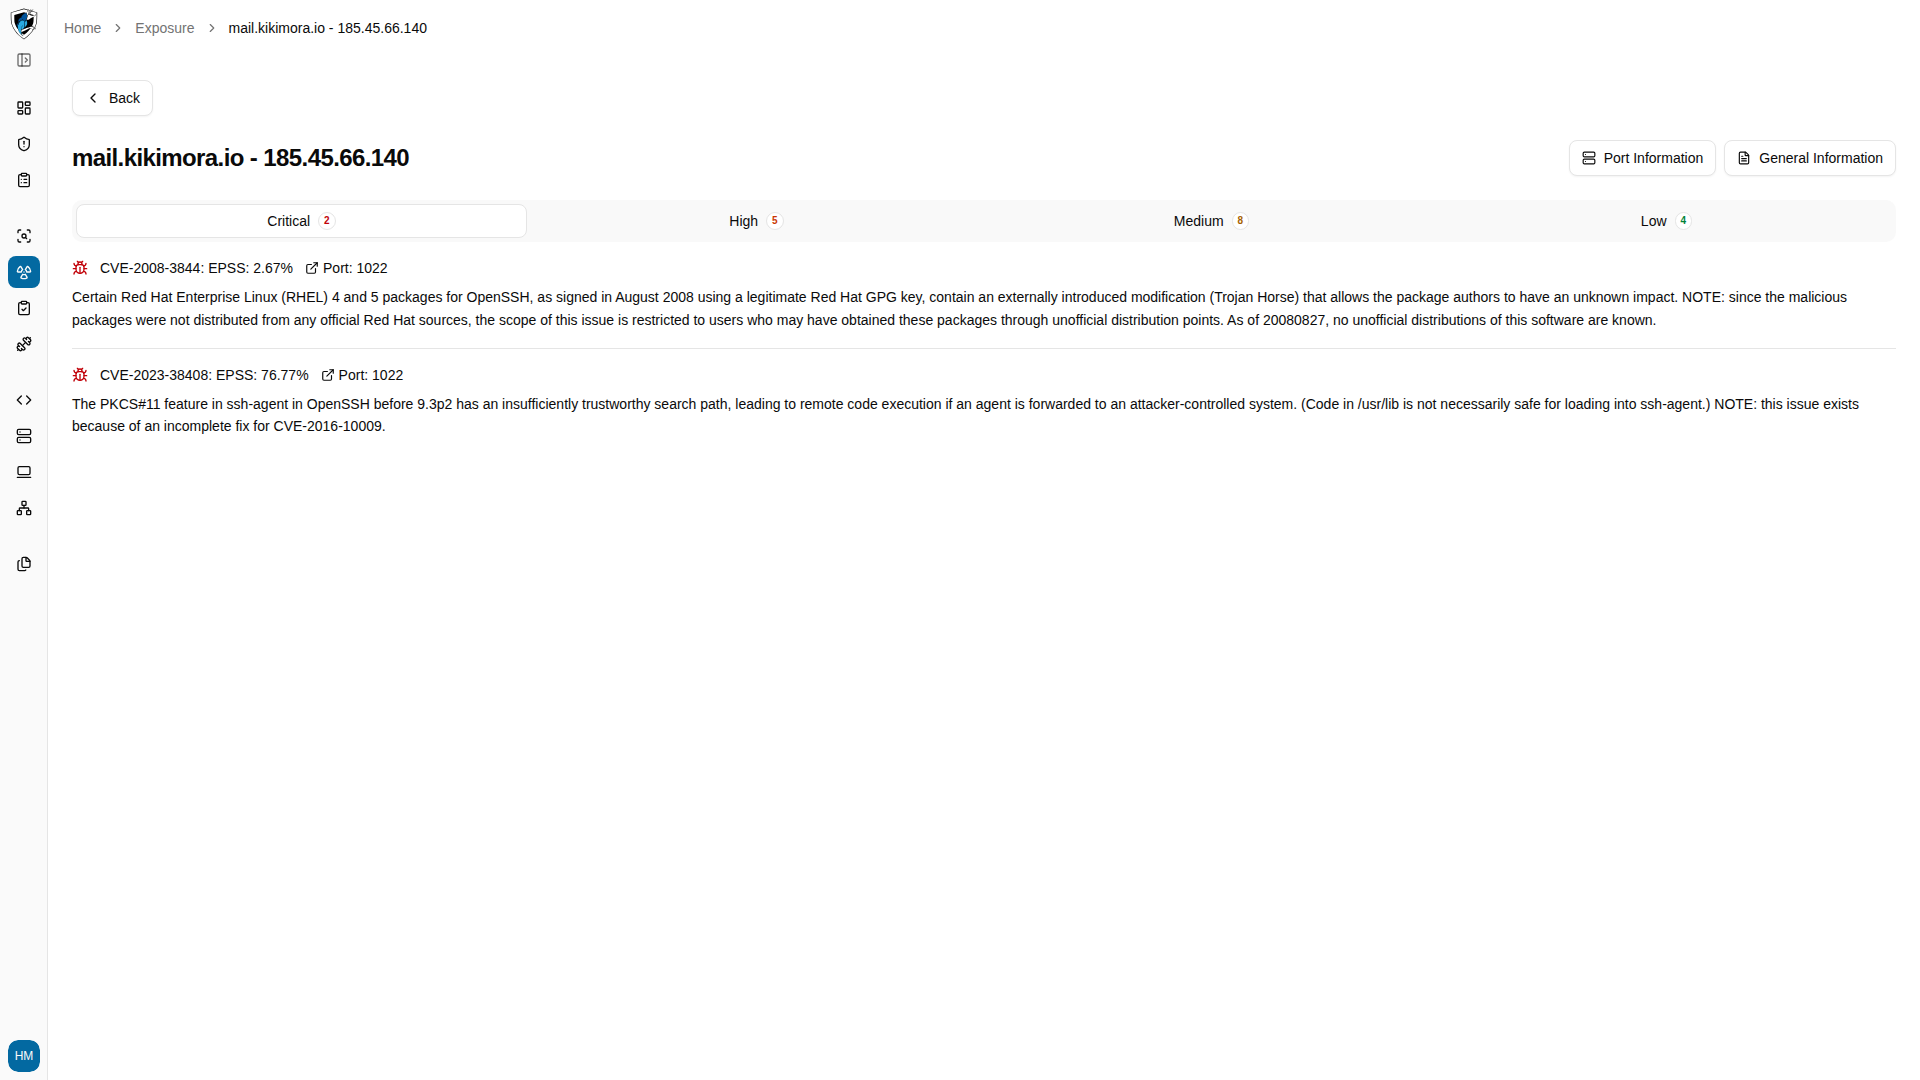
- Vulnerabilities — the CVEs associated with the asset, grouped into Critical, High, Medium, and Low tabs.
- EPSS scores — the Exploit Prediction Scoring System percentage for each discovered CVE, indicating how likely that vulnerability is to be exploited in the wild.
- Port information — the ports discovered open on the asset, the service running on each, and the raw service banner captured from it.
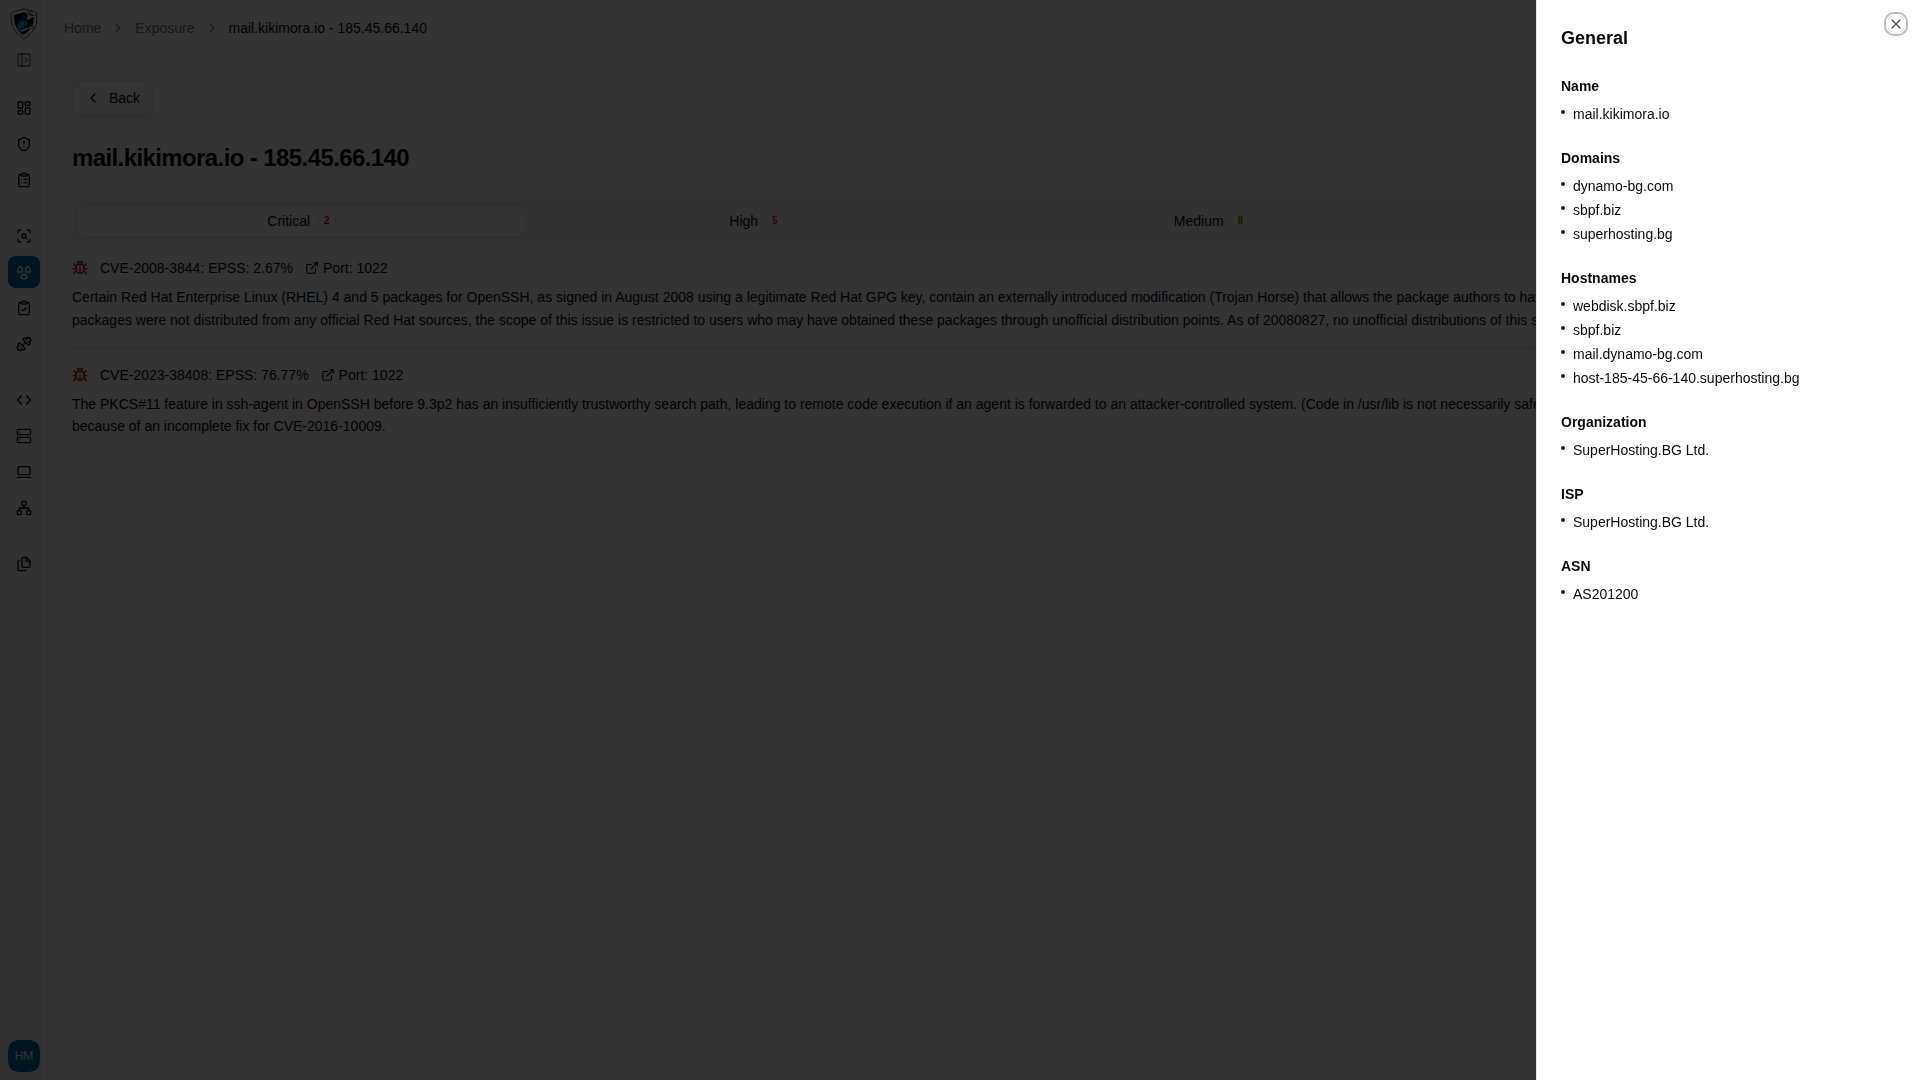
- General information — the asset’s name, its associated domains and hostnames, and the organization, ISP, and ASN that own its IP address.
Inspect an asset
-
In the Exposure table, click any domain name or IP address link.
-
The asset detail view opens on its vulnerabilities, grouped into Critical, High, Medium, and Low tabs. Each entry shows its CVE, EPSS percentage, the port it was found on, and a description.
-
Click General Information for the asset’s identity and hosting metadata: Name, associated Domains and Hostnames, and the Organization, ISP, and ASN behind its IP address.
-
Click Port Information to open the Port Logs panel, then select a port from the Select port combobox to see the service name and its raw banner output. When no log has been captured for the selected port, the panel reads
No details available for port .