

The endpoint table
The main page at/compliance/file-integrity lists every monitored endpoint.
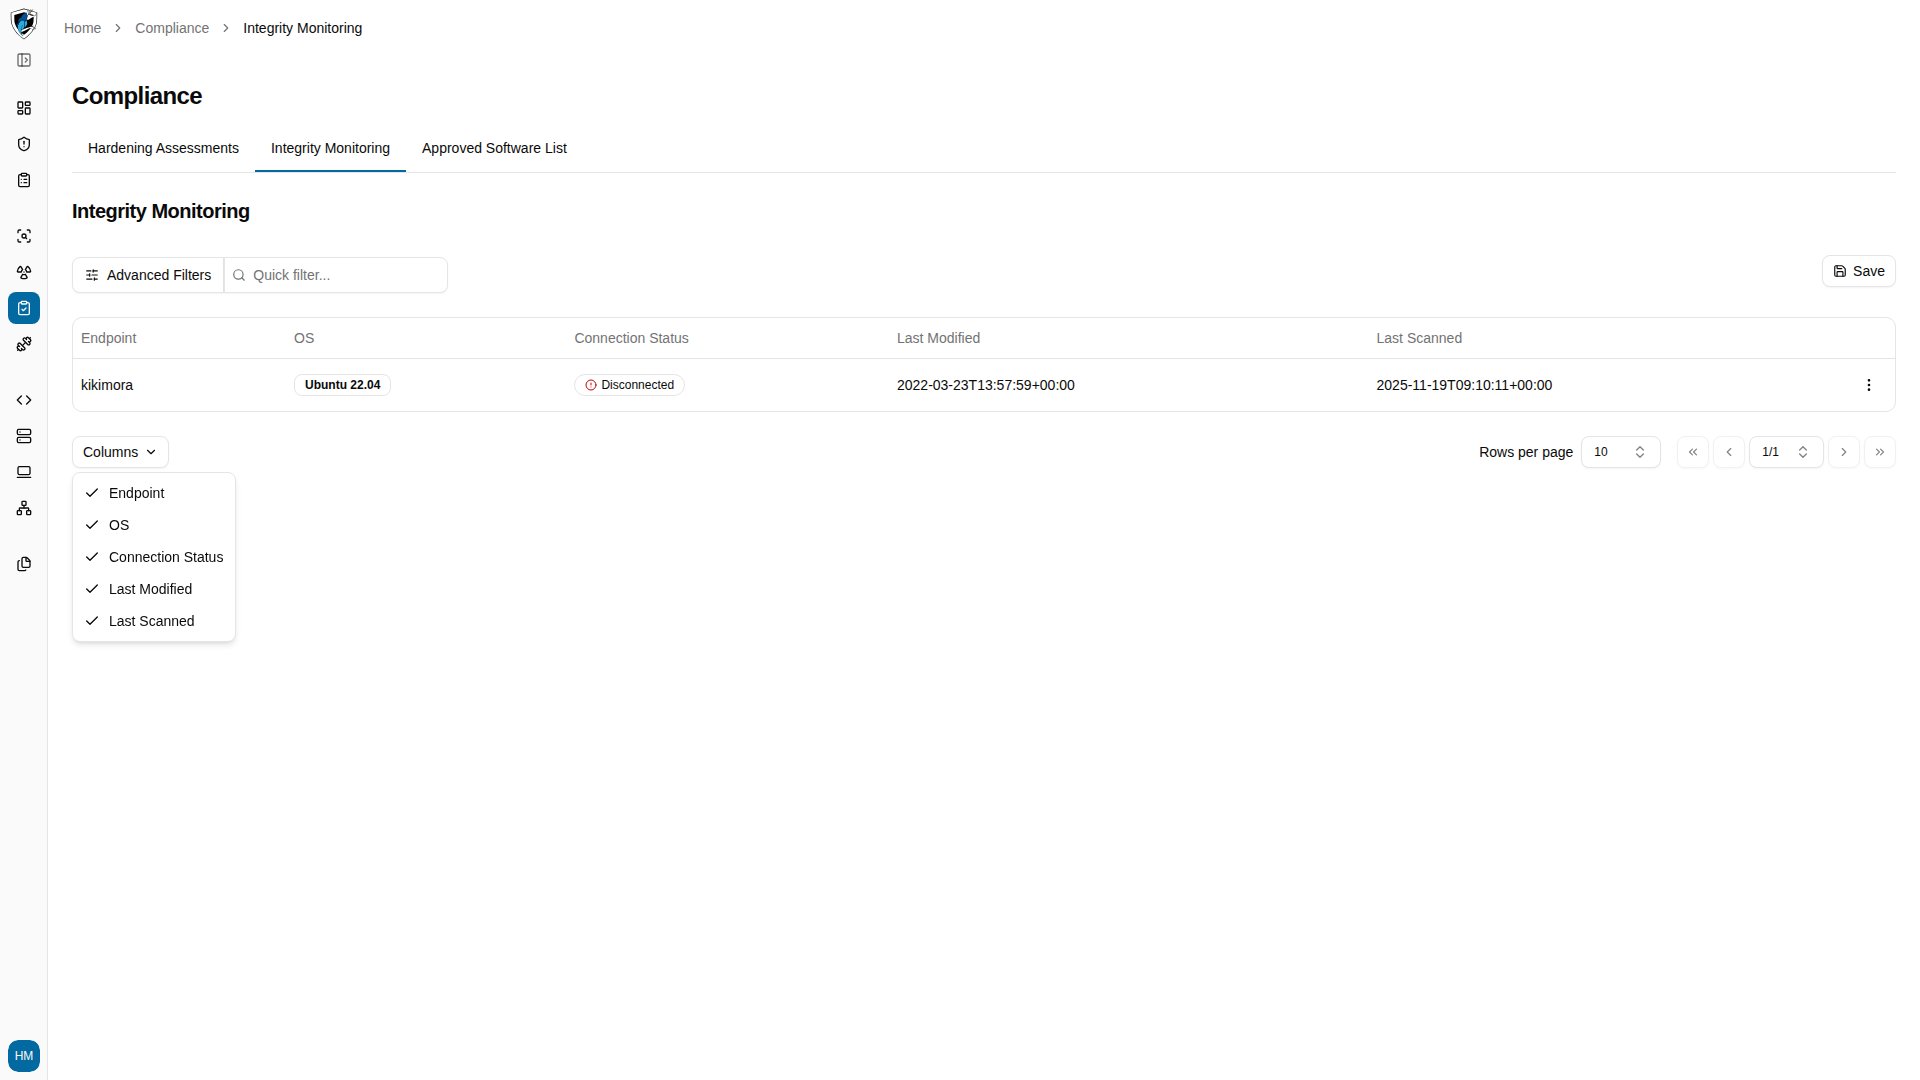
Controls: a Quick filter… search box above the table, an Advanced Filters button for multi-attribute filtering, a Columns button at the bottom left to toggle any of the five columns, and pagination at the bottom right with a default page size of 10.
Review integrity results
-
Go to Compliance → Integrity Monitoring (
/compliance/file-integrity). The table lists every endpoint reporting integrity data.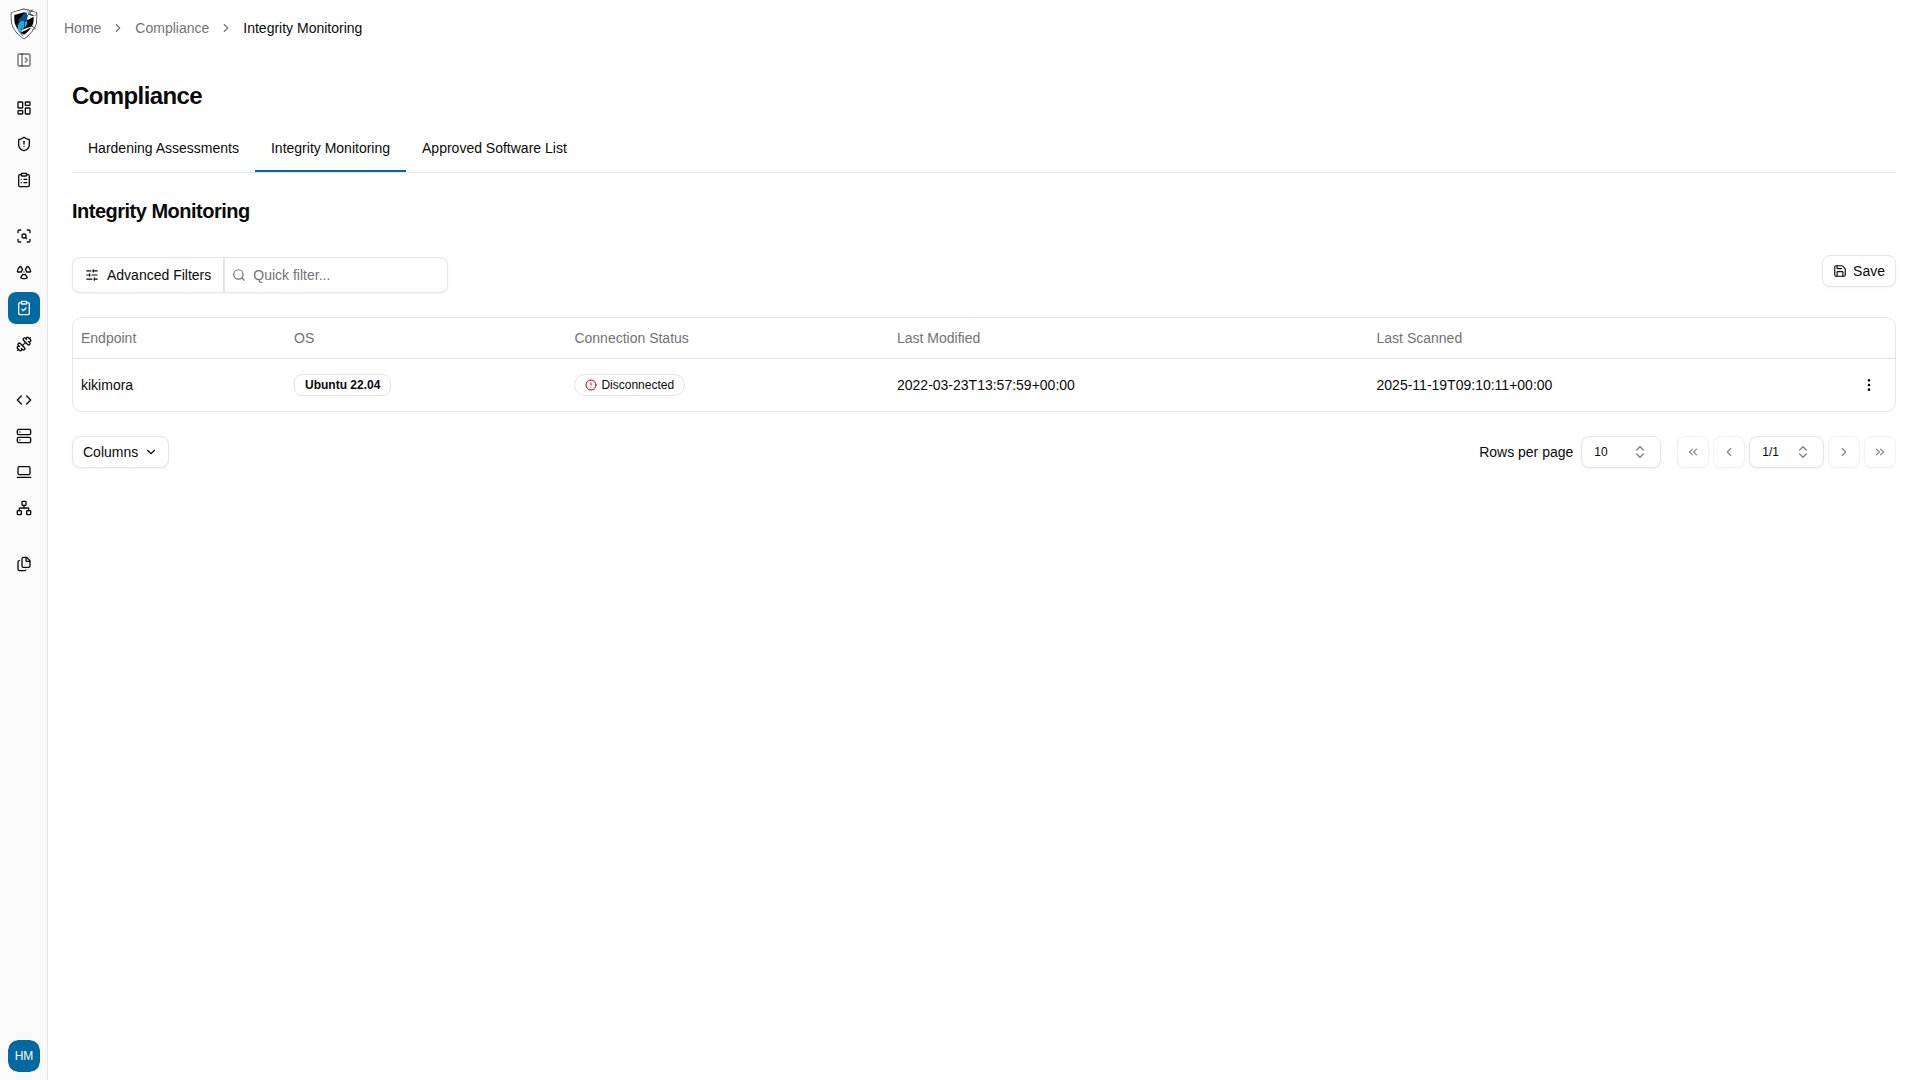
-
Click Columns at the bottom left to configure which columns are visible.
-
Click an endpoint’s name to open its detail page at
/compliance/file-integrity/<endpoint-id>. It opens on the Files sub-tab, listing every monitored file change.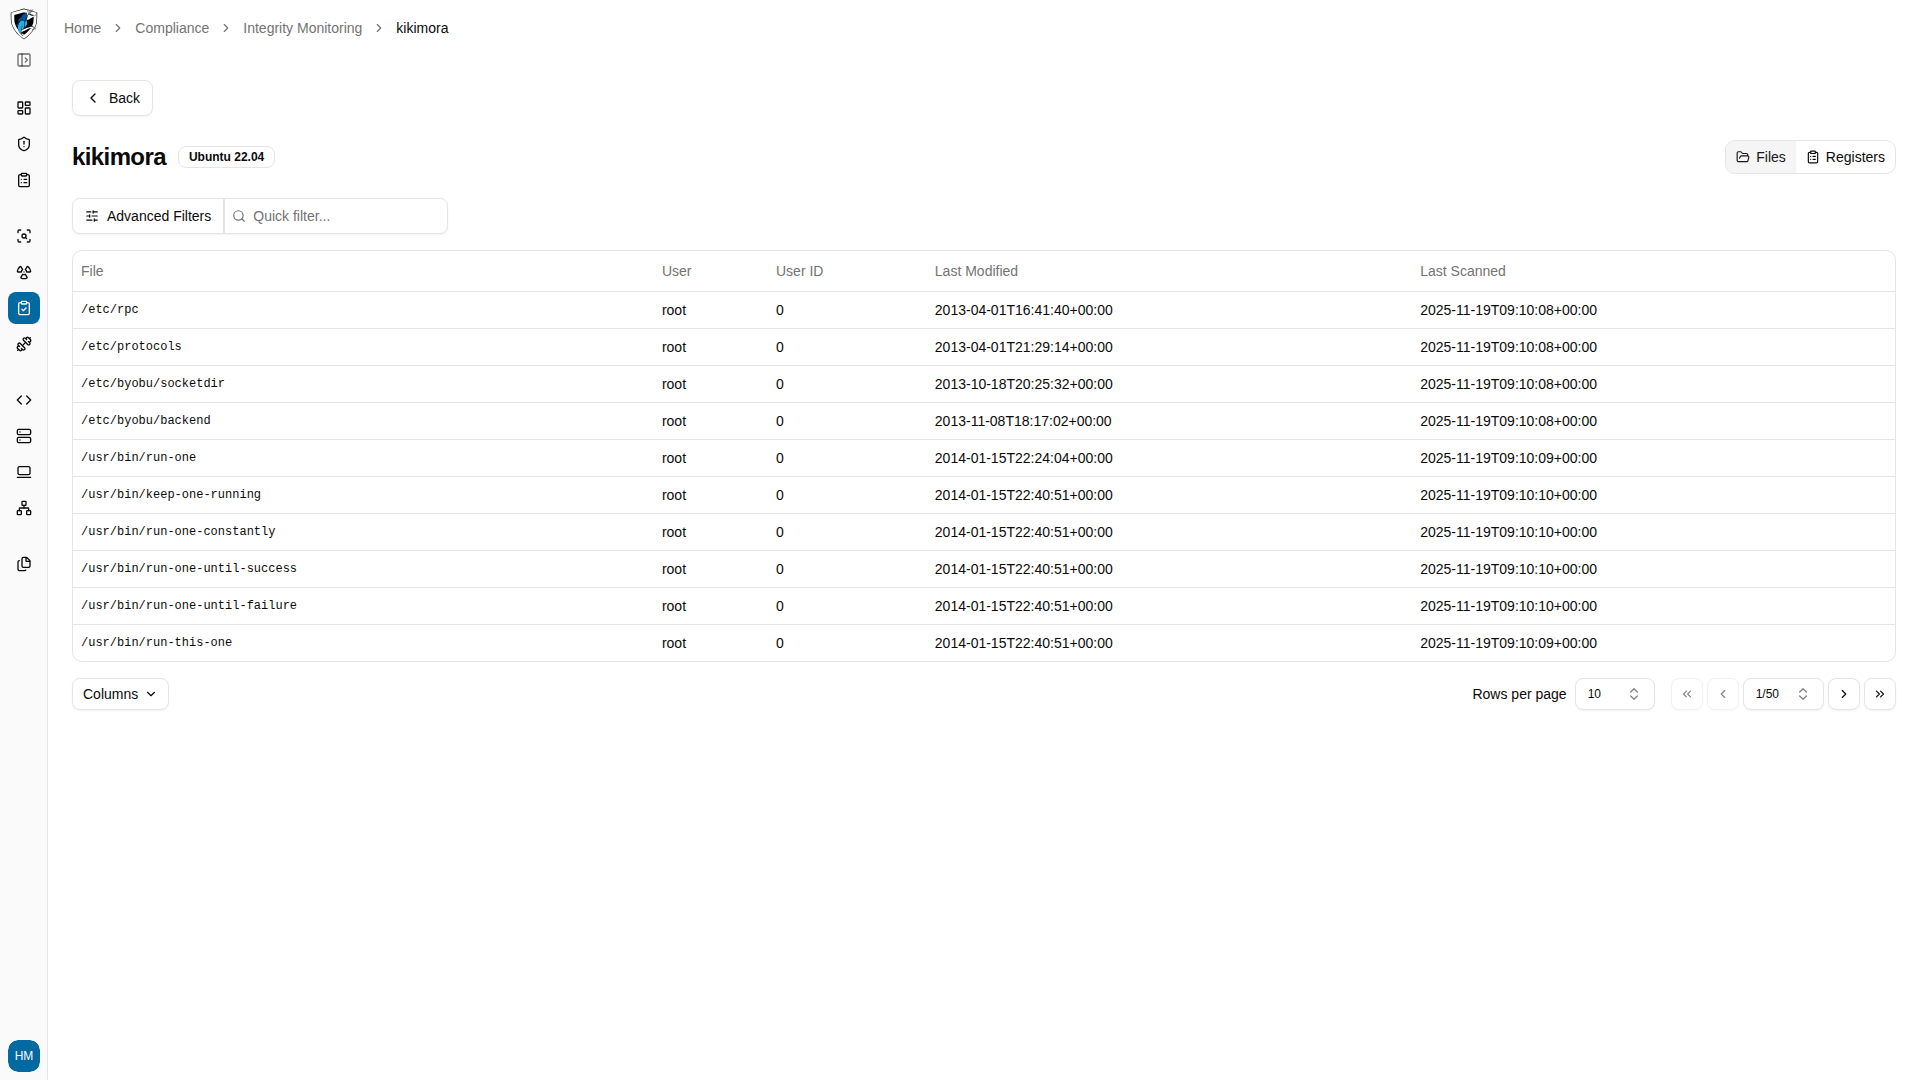
-
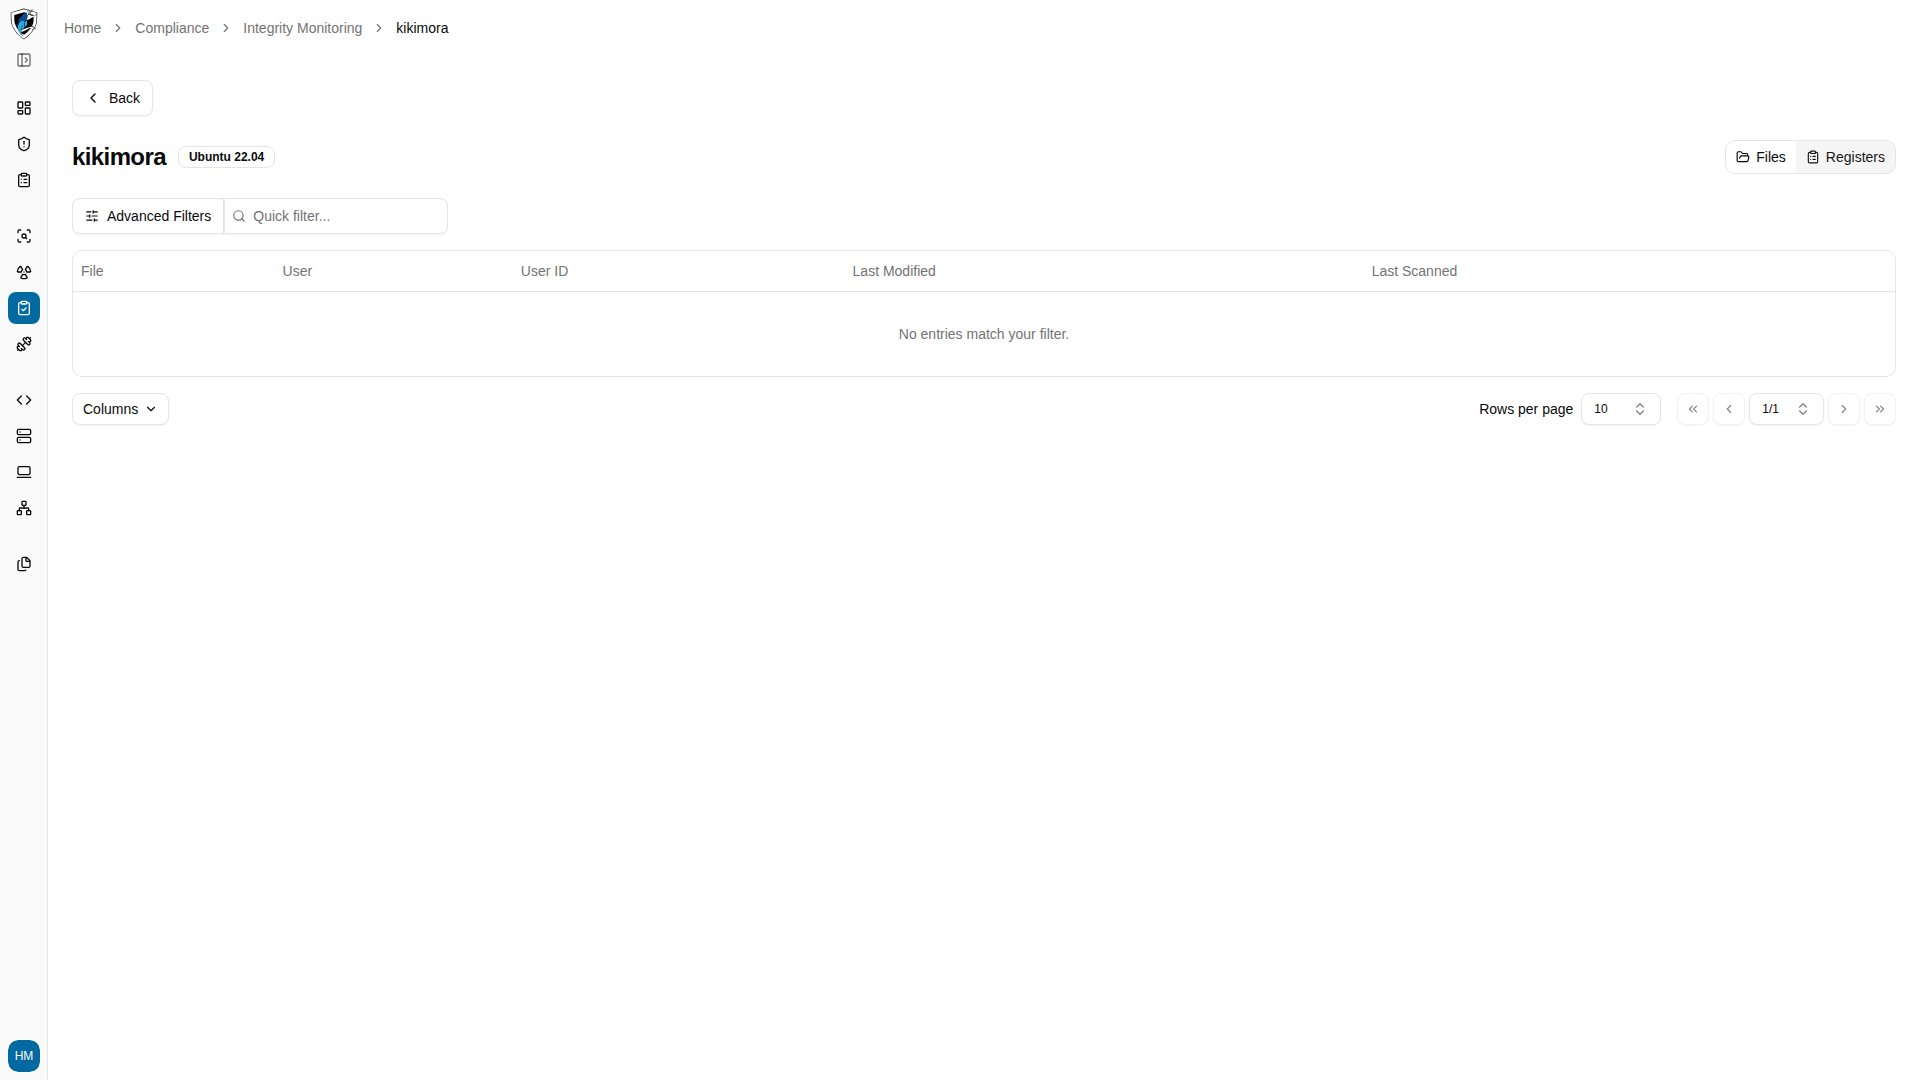
Click the Registers sub-tab for Windows Registry key and value changes. On non-Windows hosts such as Linux, this tab shows an empty state confirming no registry entries apply.
Interpreting an entry
Three things make an entry readable:- File or registry path pinpoints exactly what is being tracked.
- User and user ID tell you who made the change, which is what separates a routine administrative update from something unexpected.
- Timestamps — comparing Last Modified against Last Scanned tells you how recently the change happened relative to the scan cycle, and therefore how fresh the finding is.