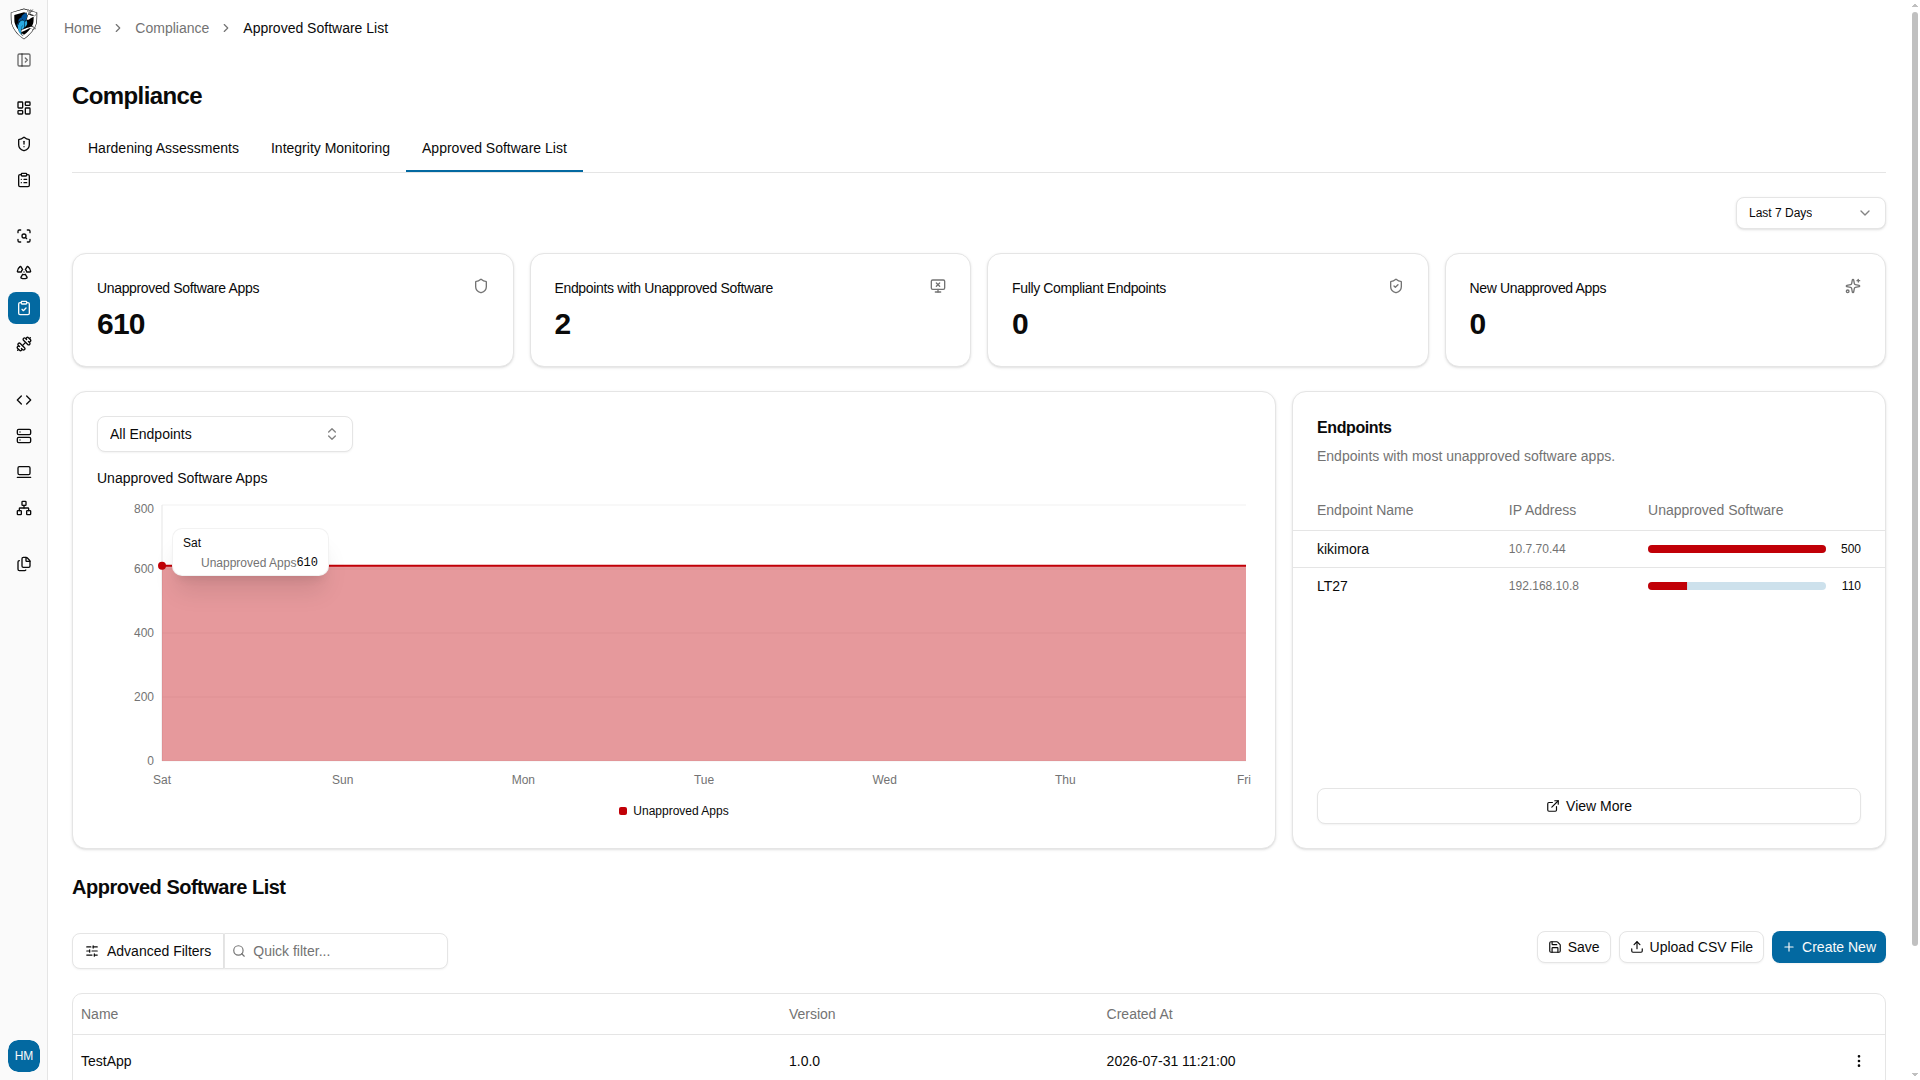

What’s on the header dashboard
Time range filter. A dropdown at the top right sets the reporting window for the metrics and trends below it: Last 7 Days, Last 3 Months, or Last 6 Months. If the trend chart renders blank, try a shorter window — a long period with only recent data leaves the plot empty. Metric cards.
Unapproved Software Apps chart. A time series showing how unapproved installations trend over the selected window.
Endpoints with Most Unapproved Software. A ranked list of your worst offenders, showing endpoint name, IP address, and total unapproved app count.
Read the posture
Open Compliance → Approved Software and start with the metric cards, then read the trend chart to see whether unapproved installations are climbing or falling across your connected endpoints.