> ## Documentation Index
> Fetch the complete documentation index at: https://docs.kikimora.io/llms.txt
> Use this file to discover all available pages before exploring further.
# Kikimora Score breakdown
> Open the score breakdown panel on any finding to see the five factors behind its Kikimora Score and how many points each one contributed.
Every finding's **Kikimora Score** is shown as a colored pill in the vulnerabilities table. The pill is not just a number — it opens a panel explaining how that score was reached, so you can see *why* a finding outranks another rather than taking the ranking on trust.
## Open the breakdown
1. On the **Vulnerabilities** page, find the **Kikimora Score** column. Each pill has an arrow button on its right, labelled *View score breakdown*.
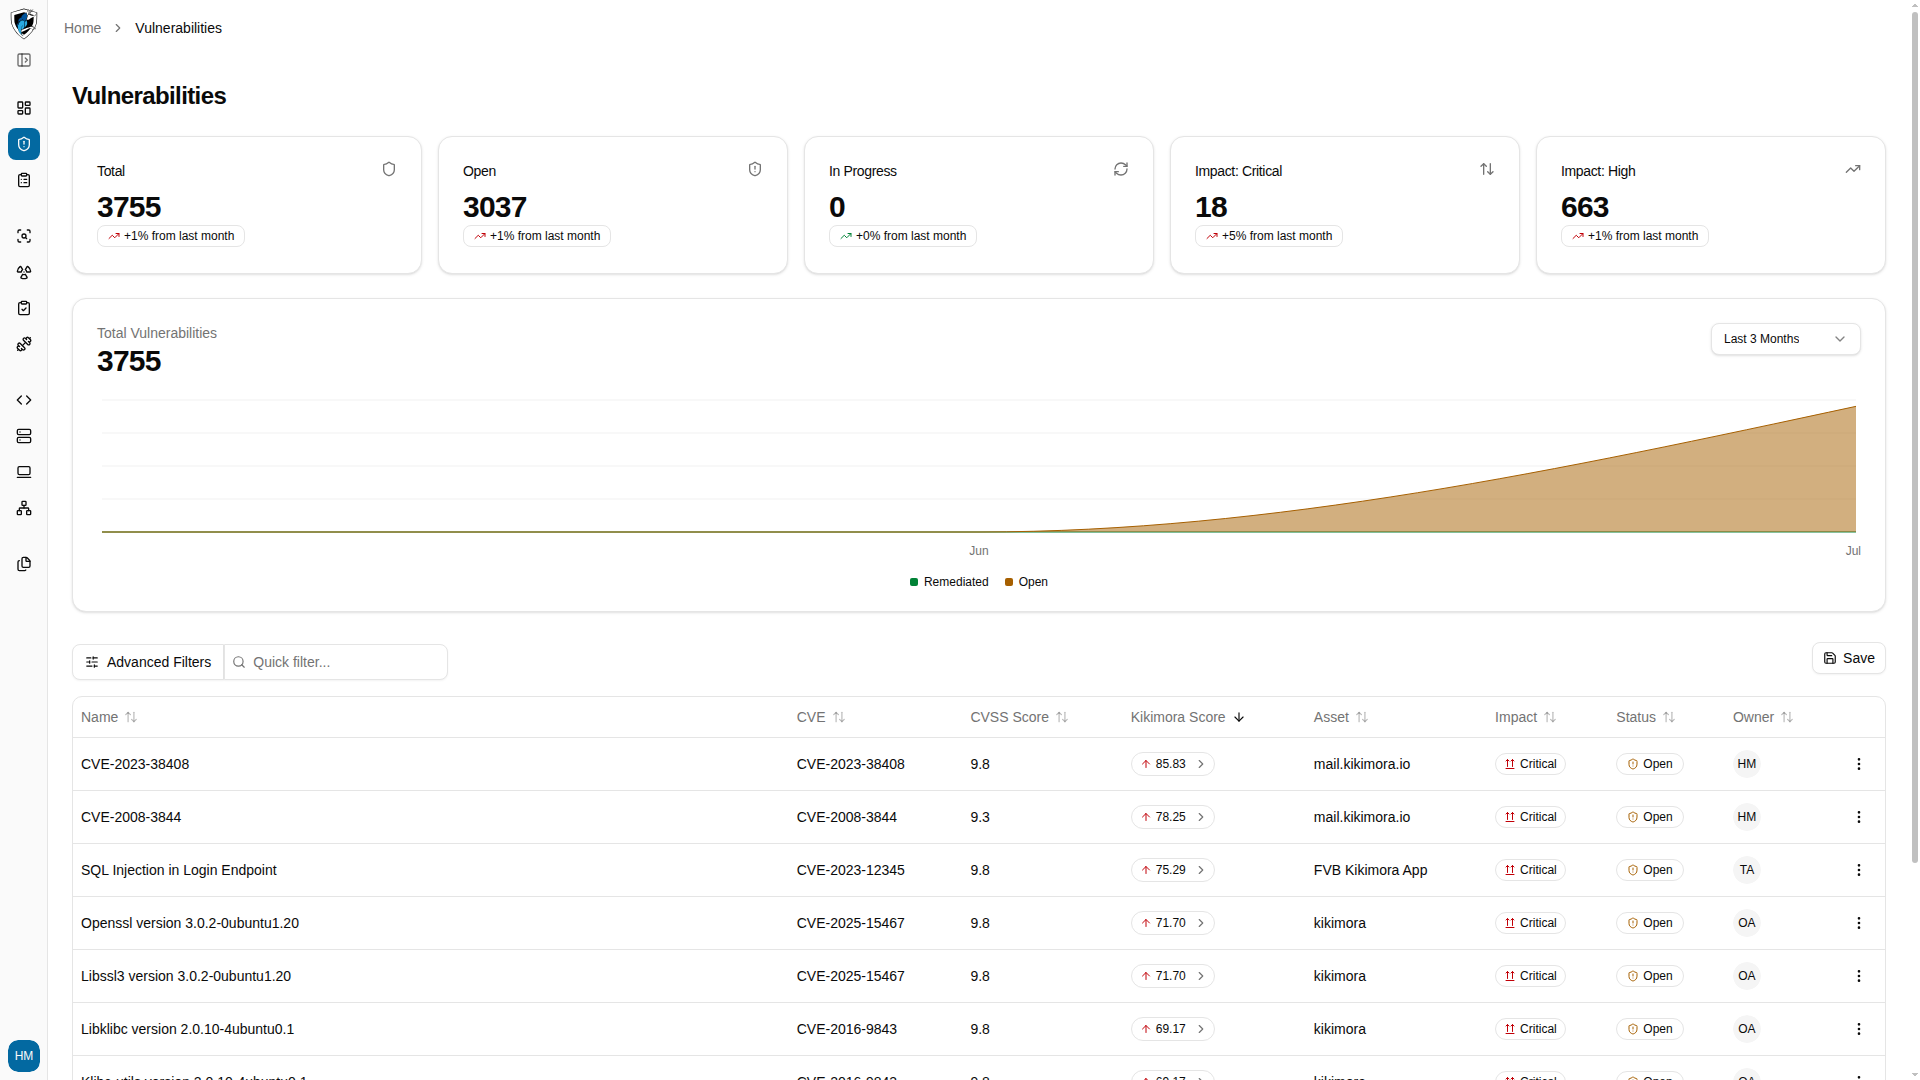 2. Click the arrow to open the breakdown panel for that finding.
 ## What the panel shows
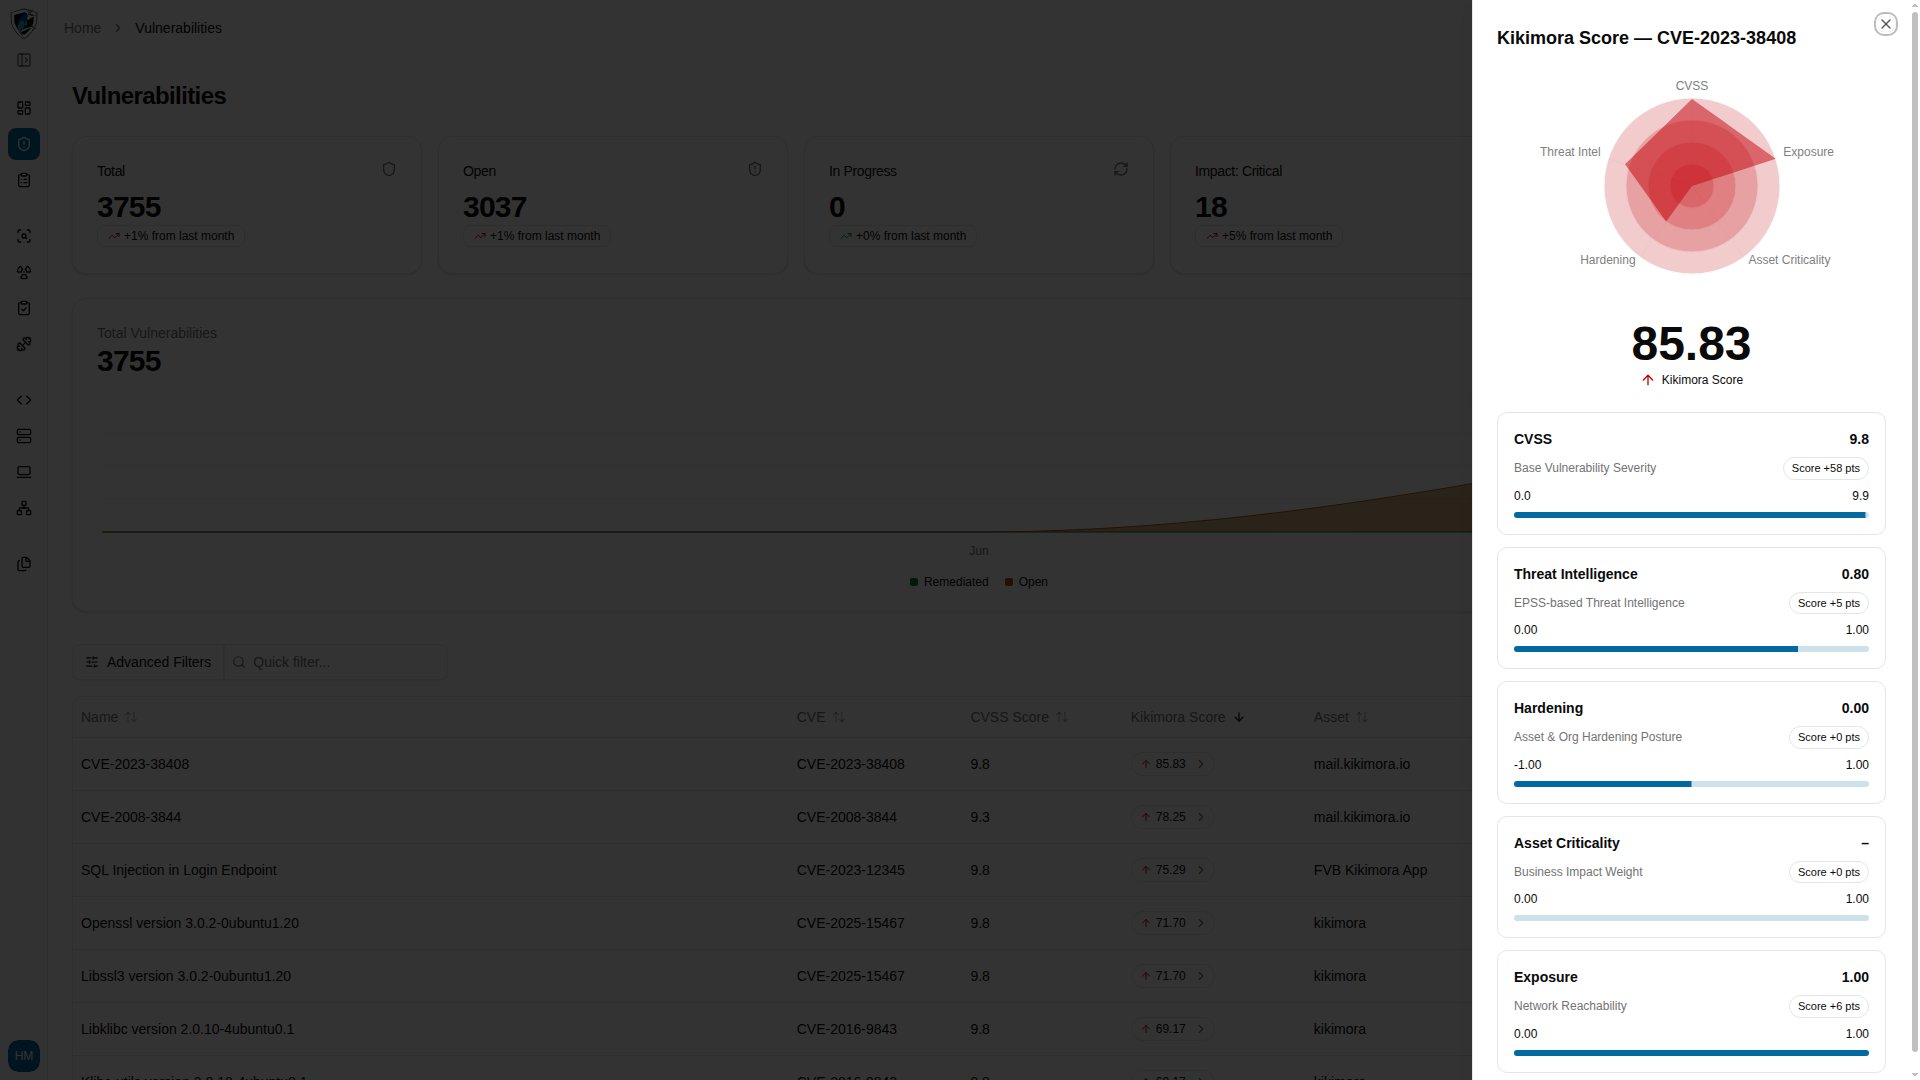
The panel is titled with the CVE it describes — for example *Kikimora Score — CVE-2023-38408*.
At the top, a radar chart plots the finding across all five factors at once, so a glance tells you which dimensions are driving the score. Below it sits the total **Kikimora Score**, and under that, one card per factor.
## The five factors
Each card shows the factor's measured value, the range it is measured on, and the points it contributed to the total.
| Factor | Measures | Range |
| :---------------------- | :------------------------------ | :----------- |
| **CVSS** | Base vulnerability severity | 0.0 – 9.9 |
| **Threat Intelligence** | EPSS-based threat intelligence | 0.00 – 1.00 |
| **Hardening** | Asset and org hardening posture | -1.00 – 1.00 |
| **Asset Criticality** | Business impact weight | 0.00 – 1.00 |
| **Exposure** | Network reachability | 0.00 – 1.00 |
**Hardening is the only factor that can subtract.** Its range starts at `-1.00`, so a well-hardened asset pulls a finding's score down, while a poorly hardened one pushes it up. The other four only ever add.
**Asset Criticality shows a dash when unset.** If nobody has assigned a business impact weight to the asset, the card reads `–` and contributes `Score +0 pts`. Setting criticality on your important assets is what makes this factor do useful work.
### Reading a worked example
For `CVE-2023-38408` scoring **85.83**:
* **CVSS** `9.8` — Score `+58 pts`. A critical base severity does most of the lifting.
* **Threat Intelligence** `0.80` — Score `+5 pts`. A high EPSS probability that this gets exploited in the wild.
* **Hardening** `0.00` — Score `+0 pts`. Neutral posture, so no adjustment either way.
* **Asset Criticality** `–` — Score `+0 pts`. No business impact weight assigned.
* **Exposure** `1.00` — Score `+6 pts`. The asset is fully network reachable.
This is what separates the Kikimora Score from a raw CVSS rating: the same CVE on an unreachable, well-hardened, low-criticality asset lands far lower than it does here.
## Related
* [Browsing and filtering](/vulnerabilities/browsing-and-filtering) — sort the table by Kikimora Score to triage by contextual risk.
* [Risk management](/risk-management/index) — how these scores aggregate into portfolio impact.
## What the panel shows
The panel is titled with the CVE it describes — for example *Kikimora Score — CVE-2023-38408*.
At the top, a radar chart plots the finding across all five factors at once, so a glance tells you which dimensions are driving the score. Below it sits the total **Kikimora Score**, and under that, one card per factor.
## The five factors
Each card shows the factor's measured value, the range it is measured on, and the points it contributed to the total.
| Factor | Measures | Range |
| :---------------------- | :------------------------------ | :----------- |
| **CVSS** | Base vulnerability severity | 0.0 – 9.9 |
| **Threat Intelligence** | EPSS-based threat intelligence | 0.00 – 1.00 |
| **Hardening** | Asset and org hardening posture | -1.00 – 1.00 |
| **Asset Criticality** | Business impact weight | 0.00 – 1.00 |
| **Exposure** | Network reachability | 0.00 – 1.00 |
**Hardening is the only factor that can subtract.** Its range starts at `-1.00`, so a well-hardened asset pulls a finding's score down, while a poorly hardened one pushes it up. The other four only ever add.
**Asset Criticality shows a dash when unset.** If nobody has assigned a business impact weight to the asset, the card reads `–` and contributes `Score +0 pts`. Setting criticality on your important assets is what makes this factor do useful work.
### Reading a worked example
For `CVE-2023-38408` scoring **85.83**:
* **CVSS** `9.8` — Score `+58 pts`. A critical base severity does most of the lifting.
* **Threat Intelligence** `0.80` — Score `+5 pts`. A high EPSS probability that this gets exploited in the wild.
* **Hardening** `0.00` — Score `+0 pts`. Neutral posture, so no adjustment either way.
* **Asset Criticality** `–` — Score `+0 pts`. No business impact weight assigned.
* **Exposure** `1.00` — Score `+6 pts`. The asset is fully network reachable.
This is what separates the Kikimora Score from a raw CVSS rating: the same CVE on an unreachable, well-hardened, low-criticality asset lands far lower than it does here.
## Related
* [Browsing and filtering](/vulnerabilities/browsing-and-filtering) — sort the table by Kikimora Score to triage by contextual risk.
* [Risk management](/risk-management/index) — how these scores aggregate into portfolio impact.