> ## Documentation Index
> Fetch the complete documentation index at: https://docs.kikimora.io/llms.txt
> Use this file to discover all available pages before exploring further.
# Browsing endpoints
> Search, filter, and shape the endpoints inventory table, and open an individual host's detail view.
The Endpoints table is the inventory of every host monitored by the Wazuh agent integration. From it you can inspect network identity, connectivity status, and risk ownership.
## Columns
| Column | Description |
| :-------------------- | :-------------------------------------------------------------------- |
| **Hostname** | Registered system host name of the endpoint. |
| **IP Address** | Primary network IP address for the host. |
| **Status** | Real-time agent connection state — **Connected** or **Disconnected**. |
| **Risk Owner** | Team member or group accountable for risk on the asset. |
| **Remediation Owner** | User responsible for applying patches and compliance fixes. |
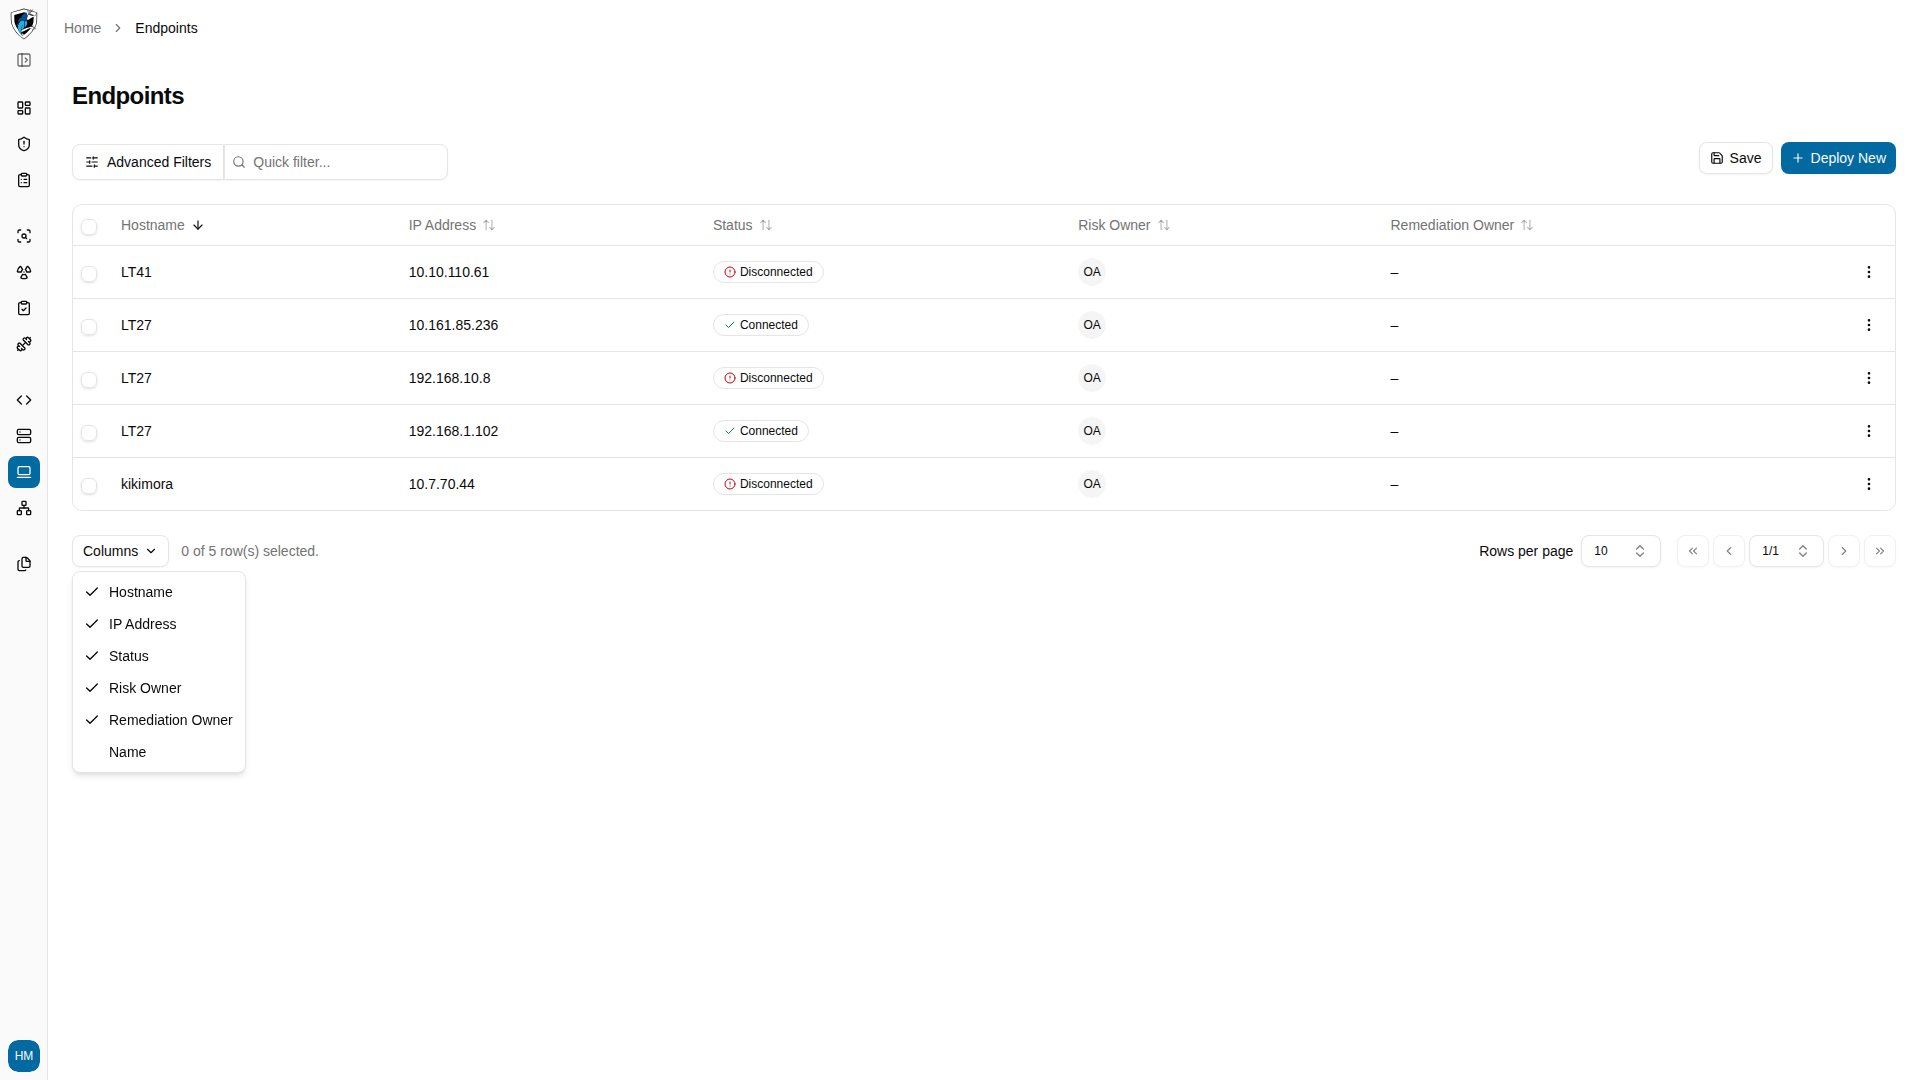
| **Name** | Optional descriptive alias for the host. Hidden by default. |
Detailed OS names and version numbers are synchronized from the agent in the background and shown in the endpoint detail view rather than this table.
## Filtering and searching
* **Quick filter** — the text field above the table matches hostname or IP address as you type.
* **Advanced Filters** — filter by status, owner assignment, or OS traits.
## Browse the inventory
1. Open `/endpoints` from the main navigation sidebar.
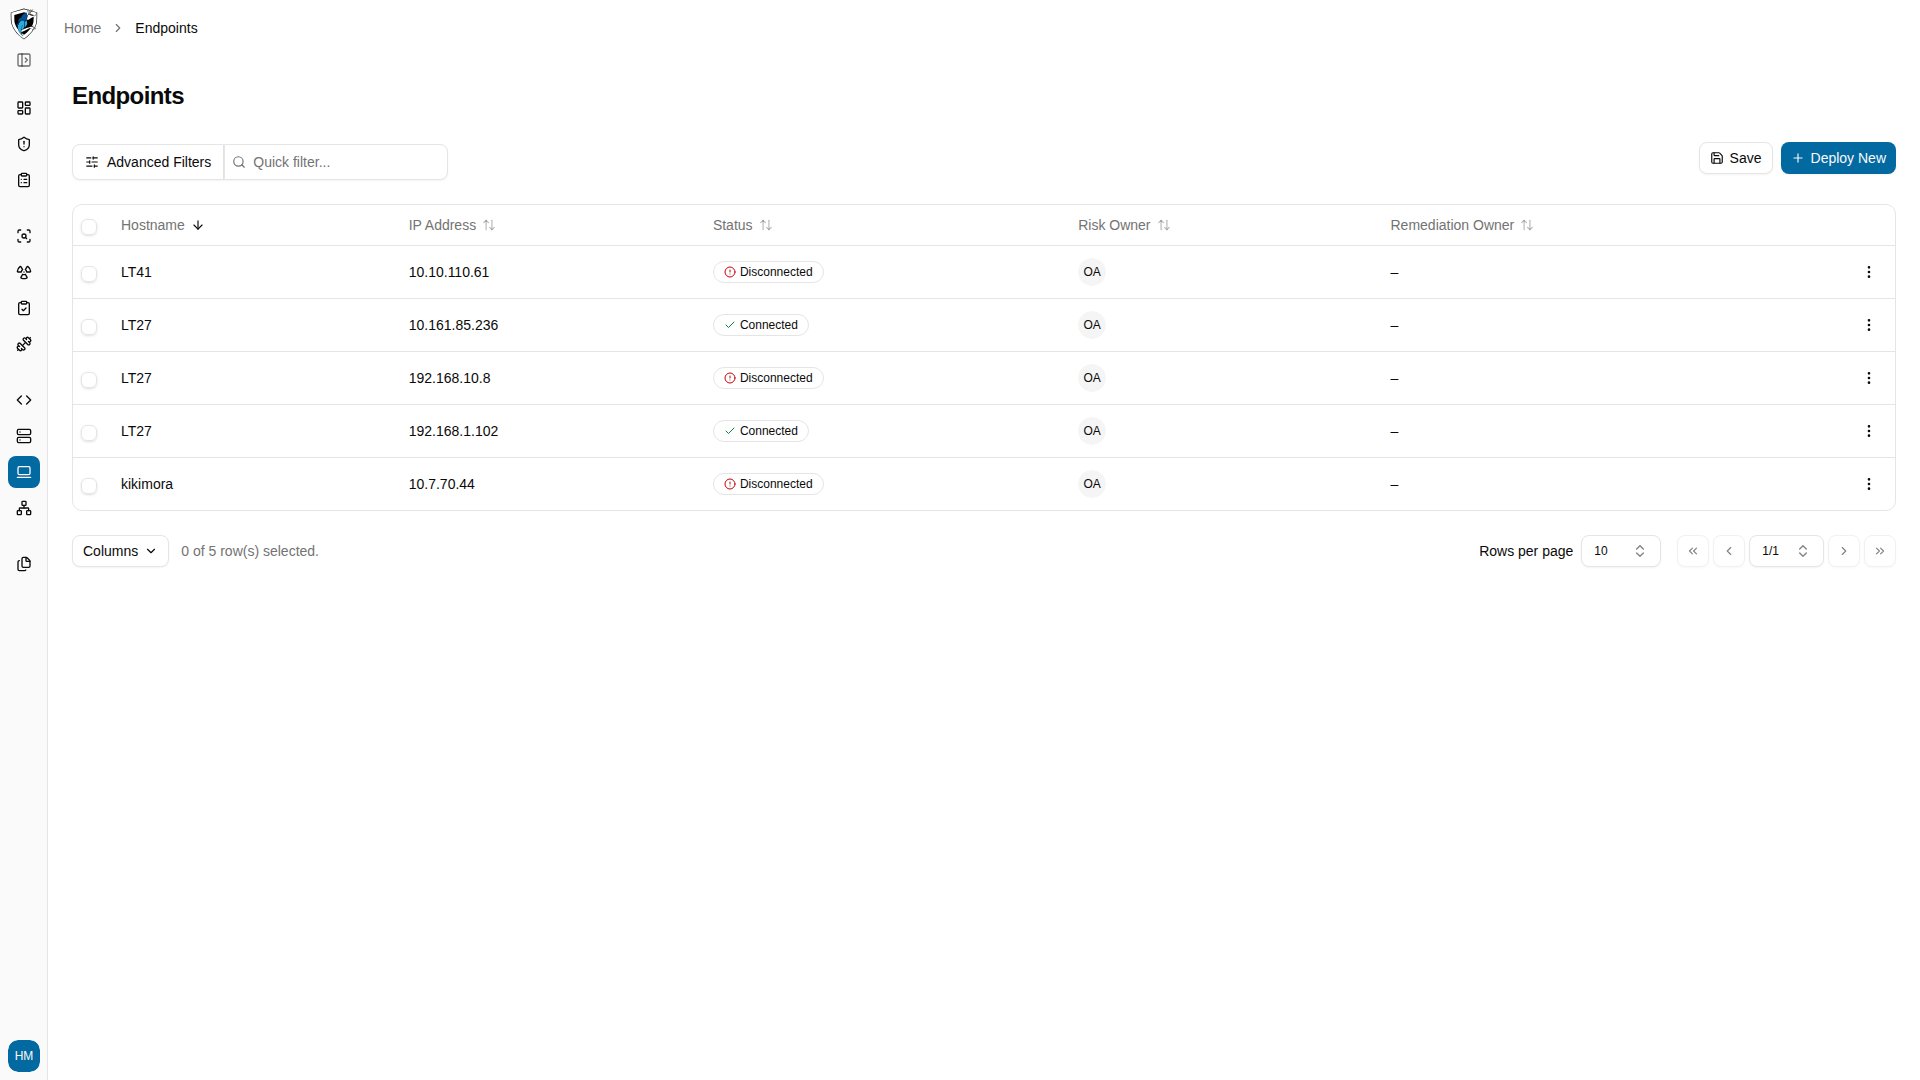 2. Click **Columns** at the bottom left of the grid to show or hide columns such as **Name**.
 3. To open a host's telemetry, click its hostname, or use the row action menu (`...`) and select **View Details**.