> ## Documentation Index
> Fetch the complete documentation index at: https://docs.kikimora.io/llms.txt
> Use this file to discover all available pages before exploring further.
# Reading the charts
> Change the time range on Dashboard time-series charts and read the tooltips that break down findings by status for each period.
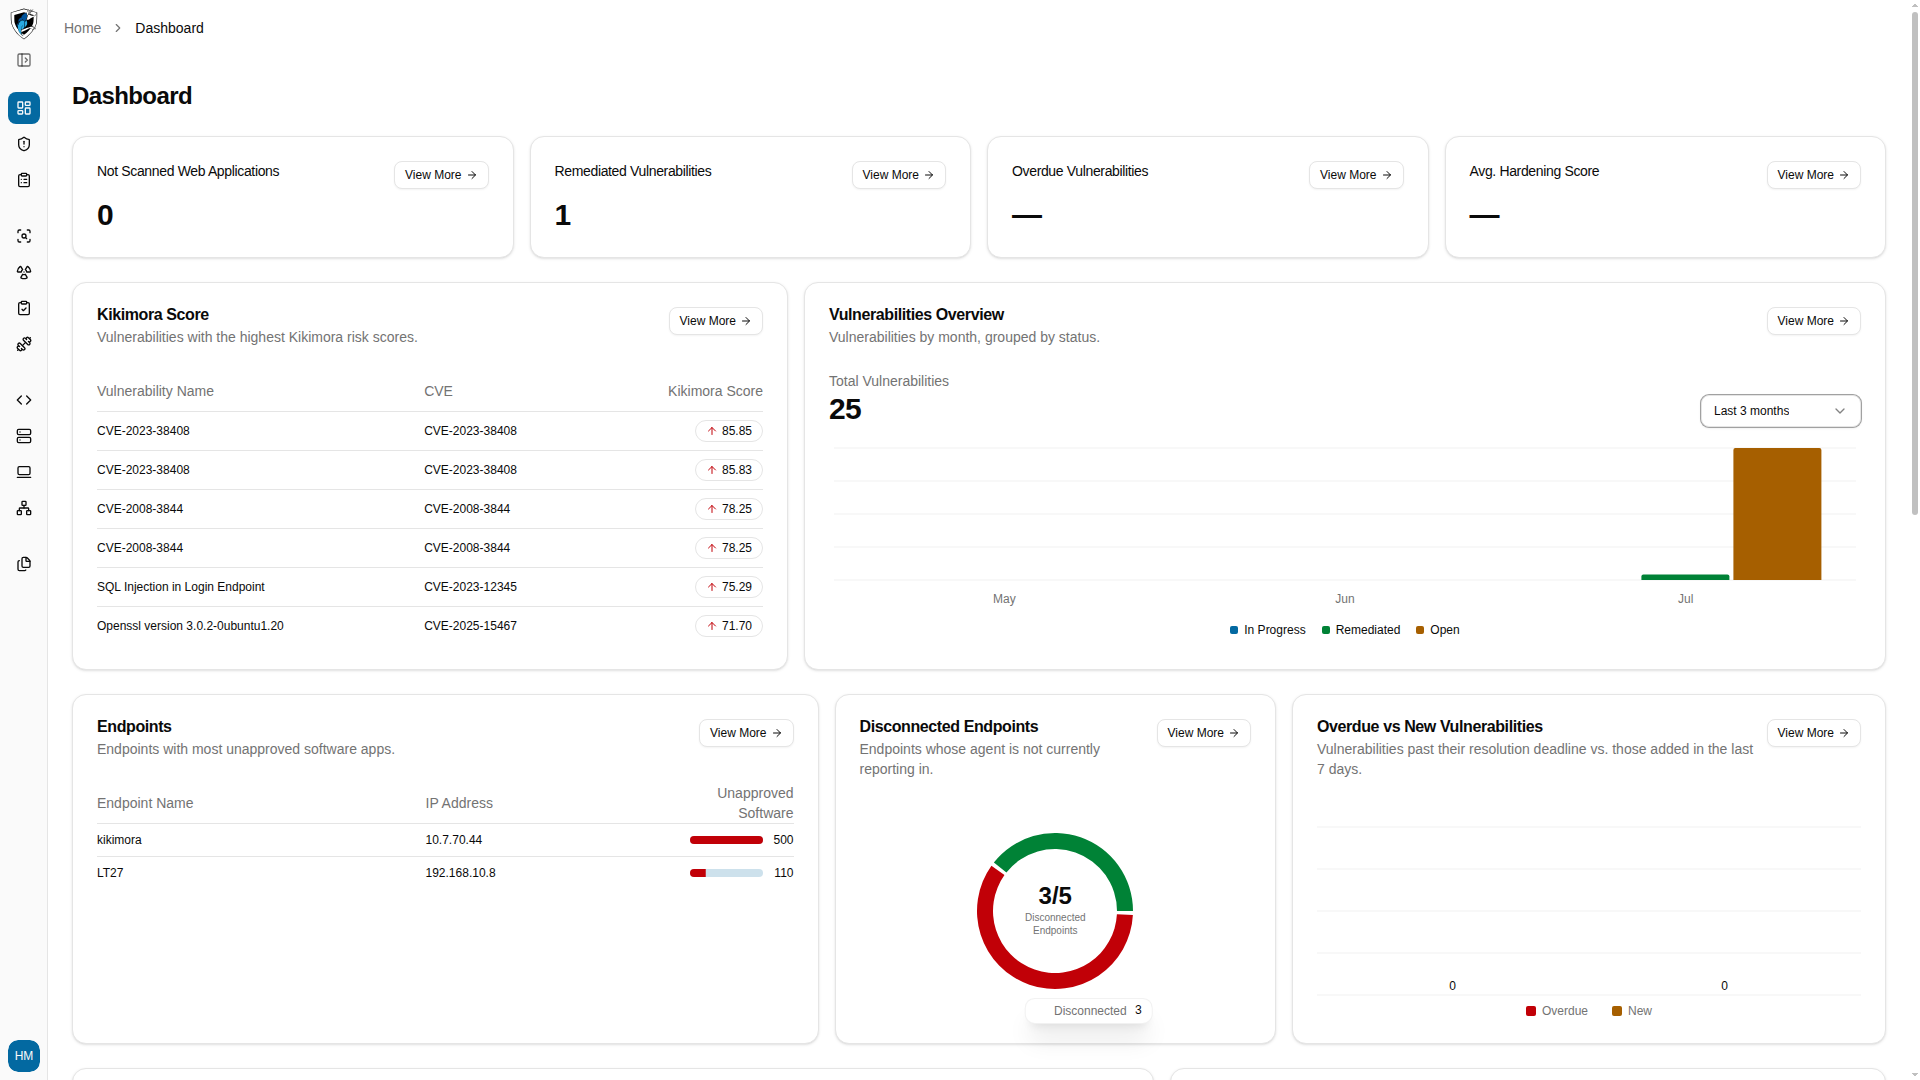
Dashboard time-series charts such as **Vulnerabilities Overview** are interactive: you can change the window they cover and hover any period for an exact breakdown.
## Time ranges
The range selector sits in the top-right corner of the chart header. Three windows are available:
* **Last 3 months** (default)
* **Last 6 months**
* **Last 12 months**
## Change the range and read a tooltip
1. Click the range selector at the top right of the **Vulnerabilities Overview** chart header to open the list of windows.
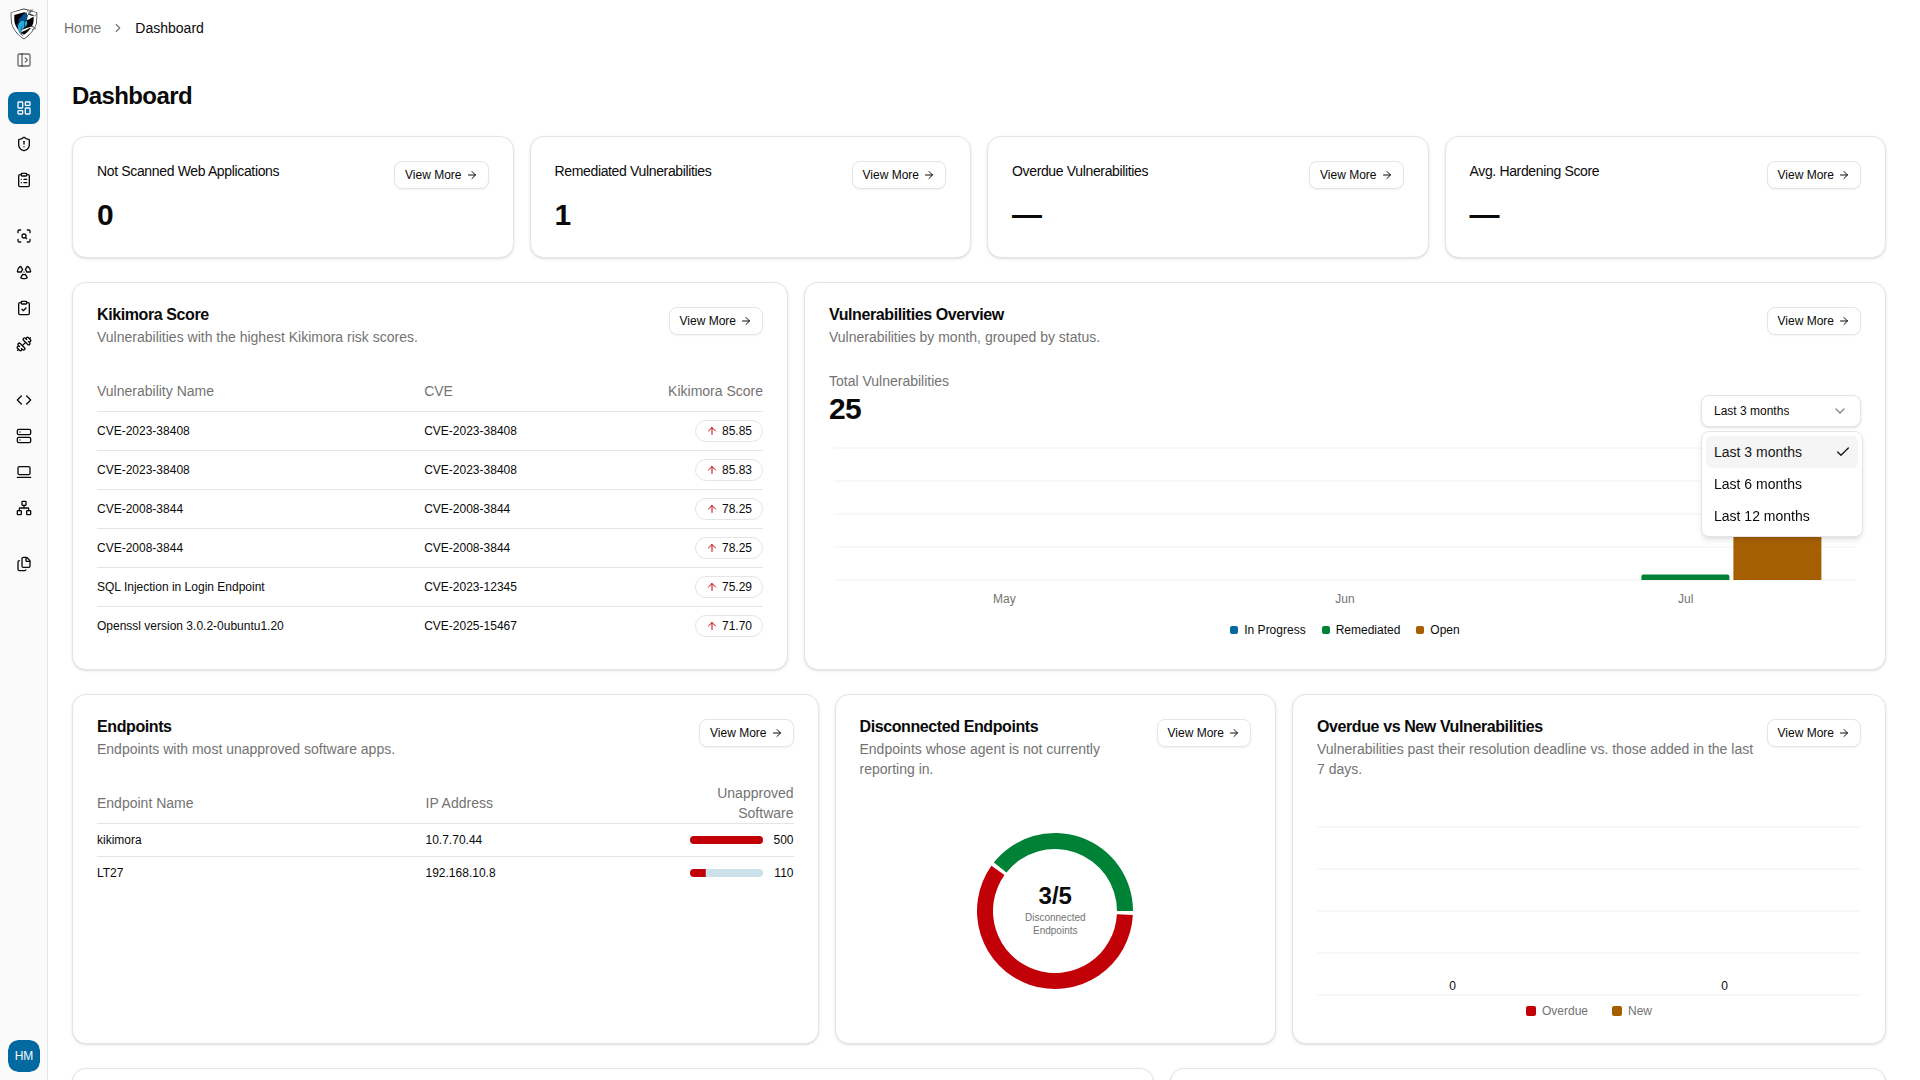 2. Click the window you want, such as **Last 6 months**. The chart redraws immediately.
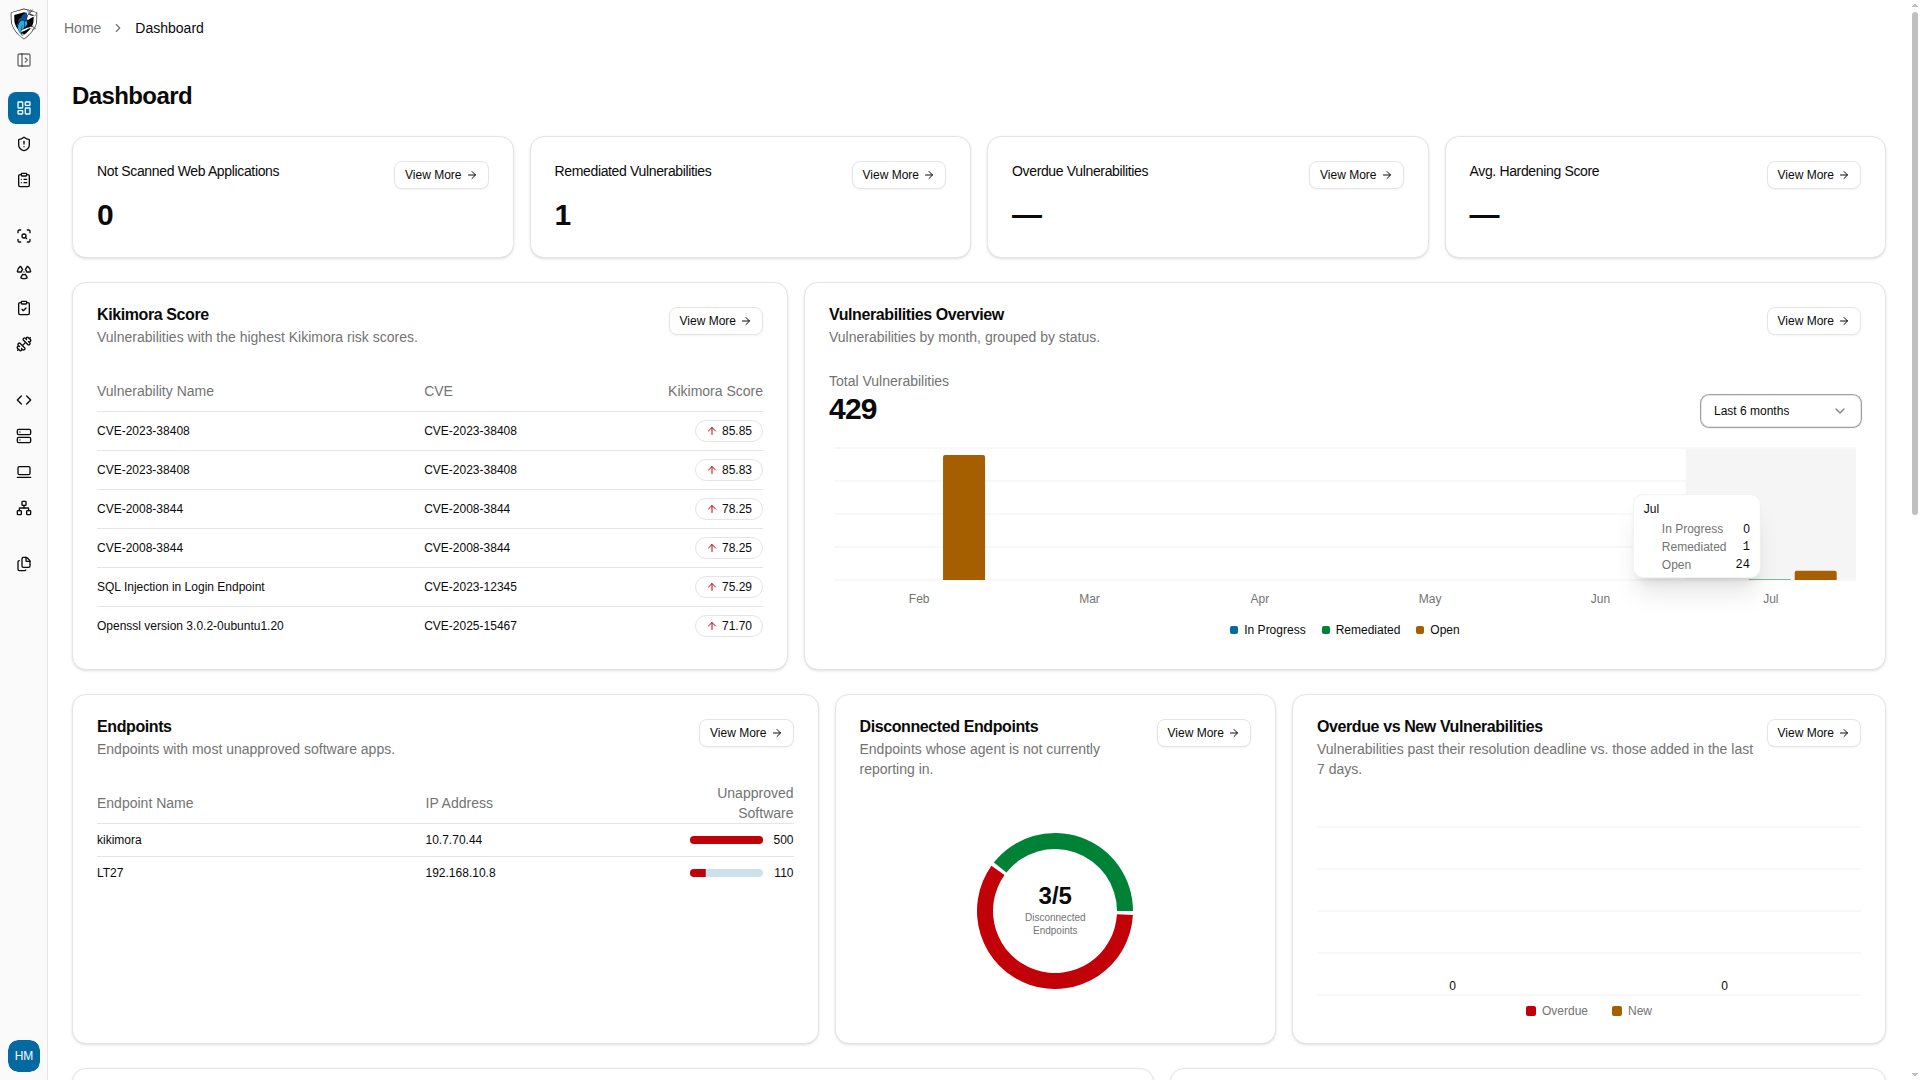 3. Hover any bar to open its tooltip, which breaks that period down into Open, Remediated, and In Progress counts.