> ## Documentation Index
> Fetch the complete documentation index at: https://docs.kikimora.io/llms.txt
> Use this file to discover all available pages before exploring further.
# Reading the charts
> Interpret the hardening dashboard's pass rate gauge, check status totals, and policy breakdown, and scope them all to a single benchmark.
The hardening dashboard summarizes endpoint compliance across every applied SCA benchmark policy.
## Dashboard components
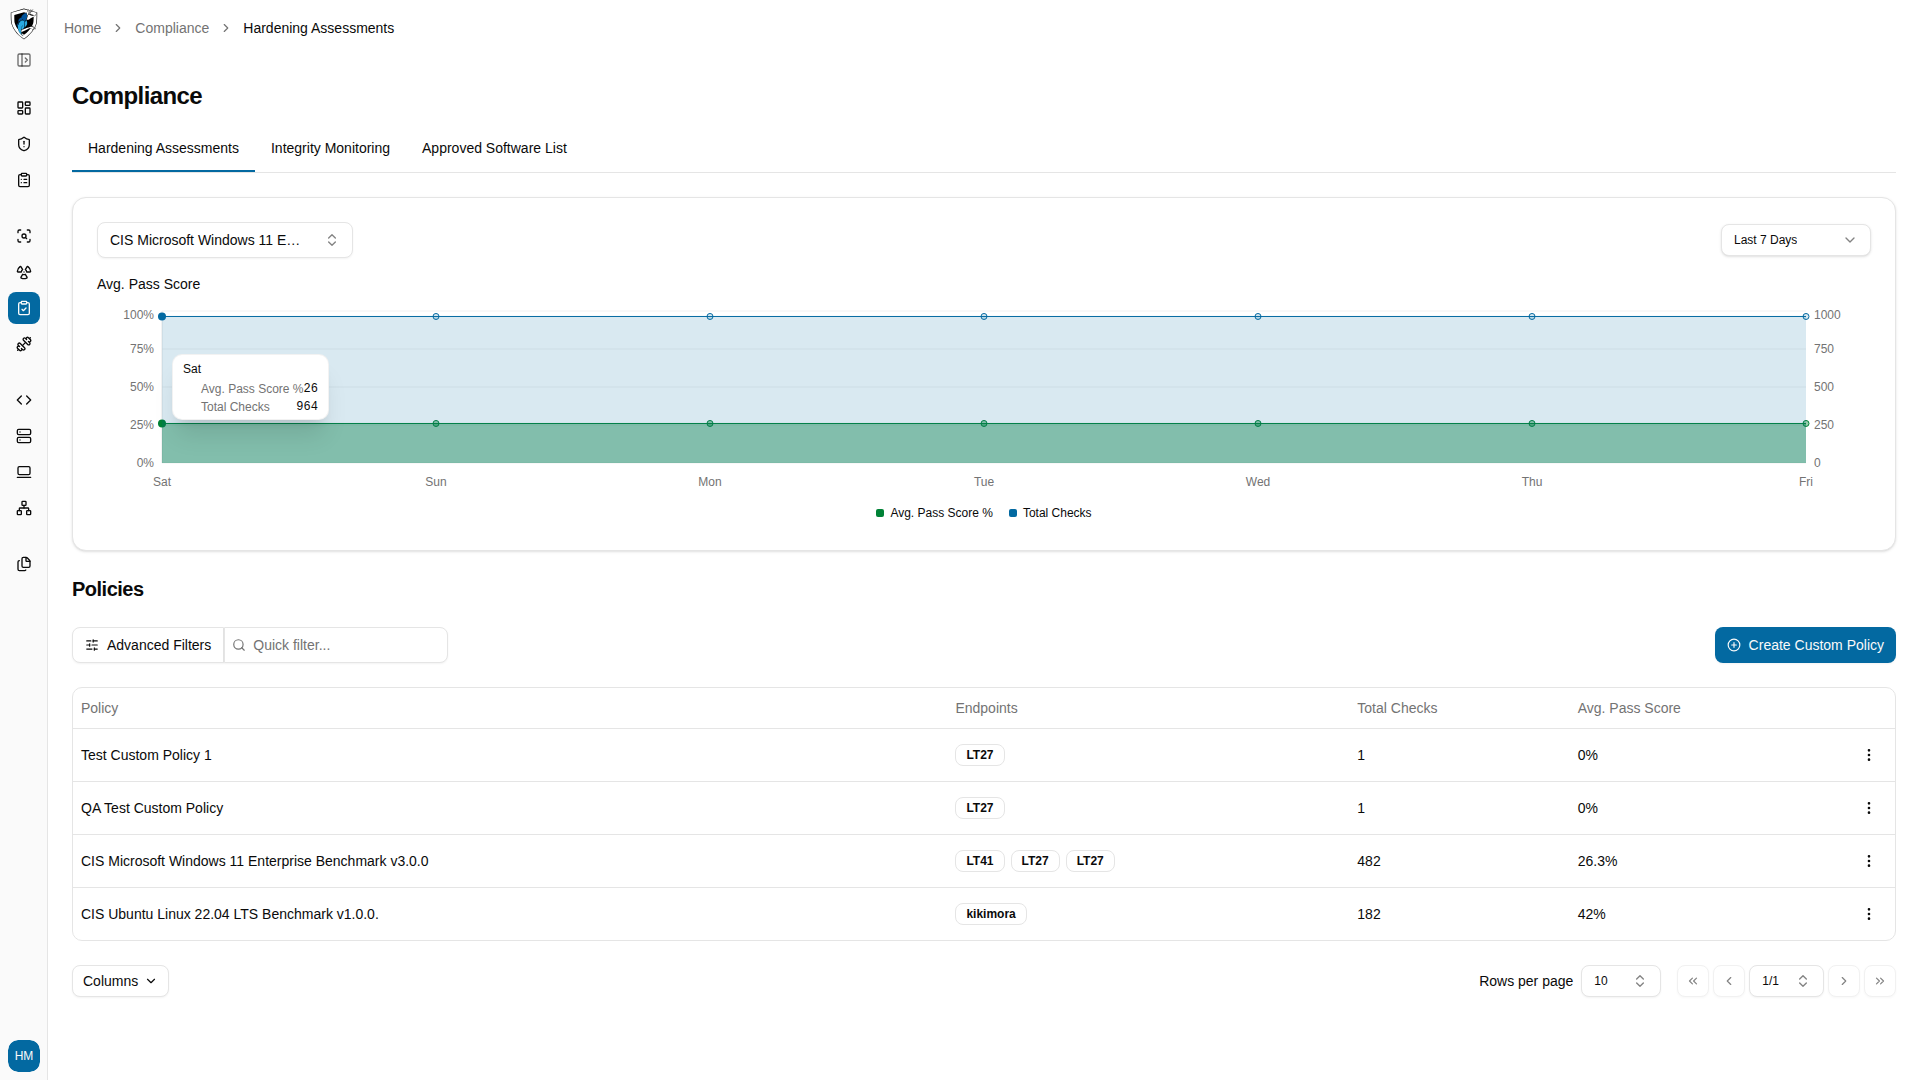
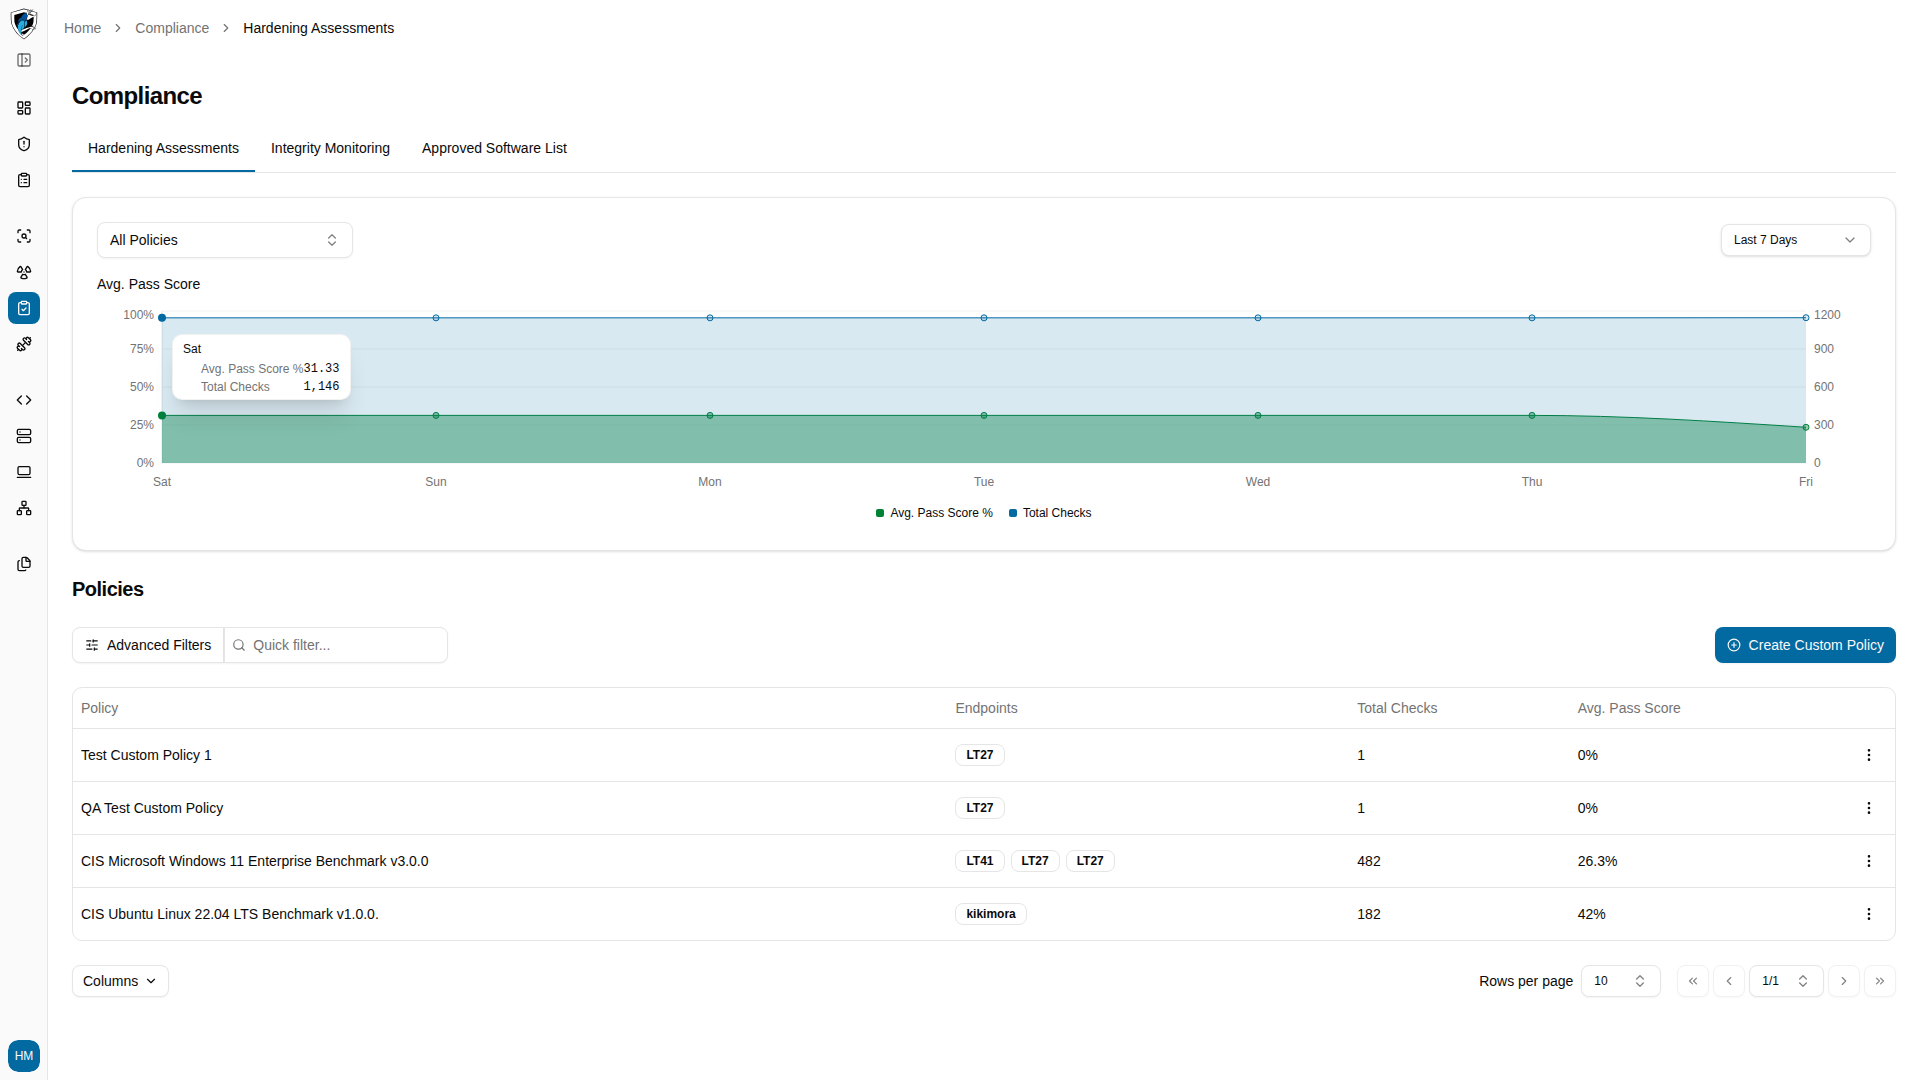
**Avg. Pass Score chart** — a time series plotting two values for the active policy scope: **Avg. Pass Score %** and **Total Checks**, each on its own axis. Hovering a point opens a tooltip with that day's exact figures. The selector at the top right sets the window — **Last 7 Days**, **Last 3 Months**, or **Last 6 Months**.
If the chart looks empty, widen or narrow the period. A long window with only recent scan data renders as a flat or blank plot.
**Passed / Failed / Not Applicable summary** — total check counts by evaluation state:
* **Passed** — configurations that comply with the policy.
* **Failed** — configurations where a misconfiguration or security risk was detected.
* **Not Applicable** — rules that do not apply to the host's OS environment.
**Policy breakdown list** — each policy's target OS, total checks, evaluated endpoints, and average pass score.
## Color coding and tooltips
Green marks passed checks, red marks failed checks, and gray or muted styling marks Not Applicable ones. Hovering a bar chart or percentage meter reveals a tooltip with the raw counts and exact percentages behind the visual.
## Scoping to one policy
The **Select Policy** combobox at the top of the page re-filters every metric instantly:
* **All Policies** aggregates scores and check tallies across every benchmark.
* A specific policy recalculates the pass rate gauge and status metrics using only the endpoints evaluated under that benchmark.
## Read the dashboard
1. Go to **Compliance → Hardening Assessments** for your global posture and benchmark summaries.
 2. Click the **Select Policy** combobox and pick a benchmark, such as *CIS Microsoft Windows 11 Enterprise Benchmark v3.0.0*, to rescope every chart to it.